> ## Documentation Index
> Fetch the complete documentation index at: https://docs.prophecy.ai/llms.txt
> Use this file to discover all available pages before exploring further.
# Exploration
> Find and preview data sources using the Prophecy Agent
One way to leverage the Prophecy Agent is to search your SQL warehouse, explore datasets, and generate insights with simple prompts. This allows you to add the appropriate sources to your pipeline that will undergo data processing. You must have source data in your pipeline to start building transformations.
The following sections describe the ways you can interact with the Agent for data exploration.
## Find tables in your SQL warehouse
Ask the Agent to search for tables in your [primary SQL warehouse](/data-analysis/environment/fabrics/prophecy-fabrics). Based on your query, it returns:
* A short list of relevant datasets and their descriptions.
* A full list of datasets that match your criteria.
You can add a dataset to the pipeline as a [Table
gem](/data-analysis/gems/source-target/source-target) directly from the chat.
### Explore datasets
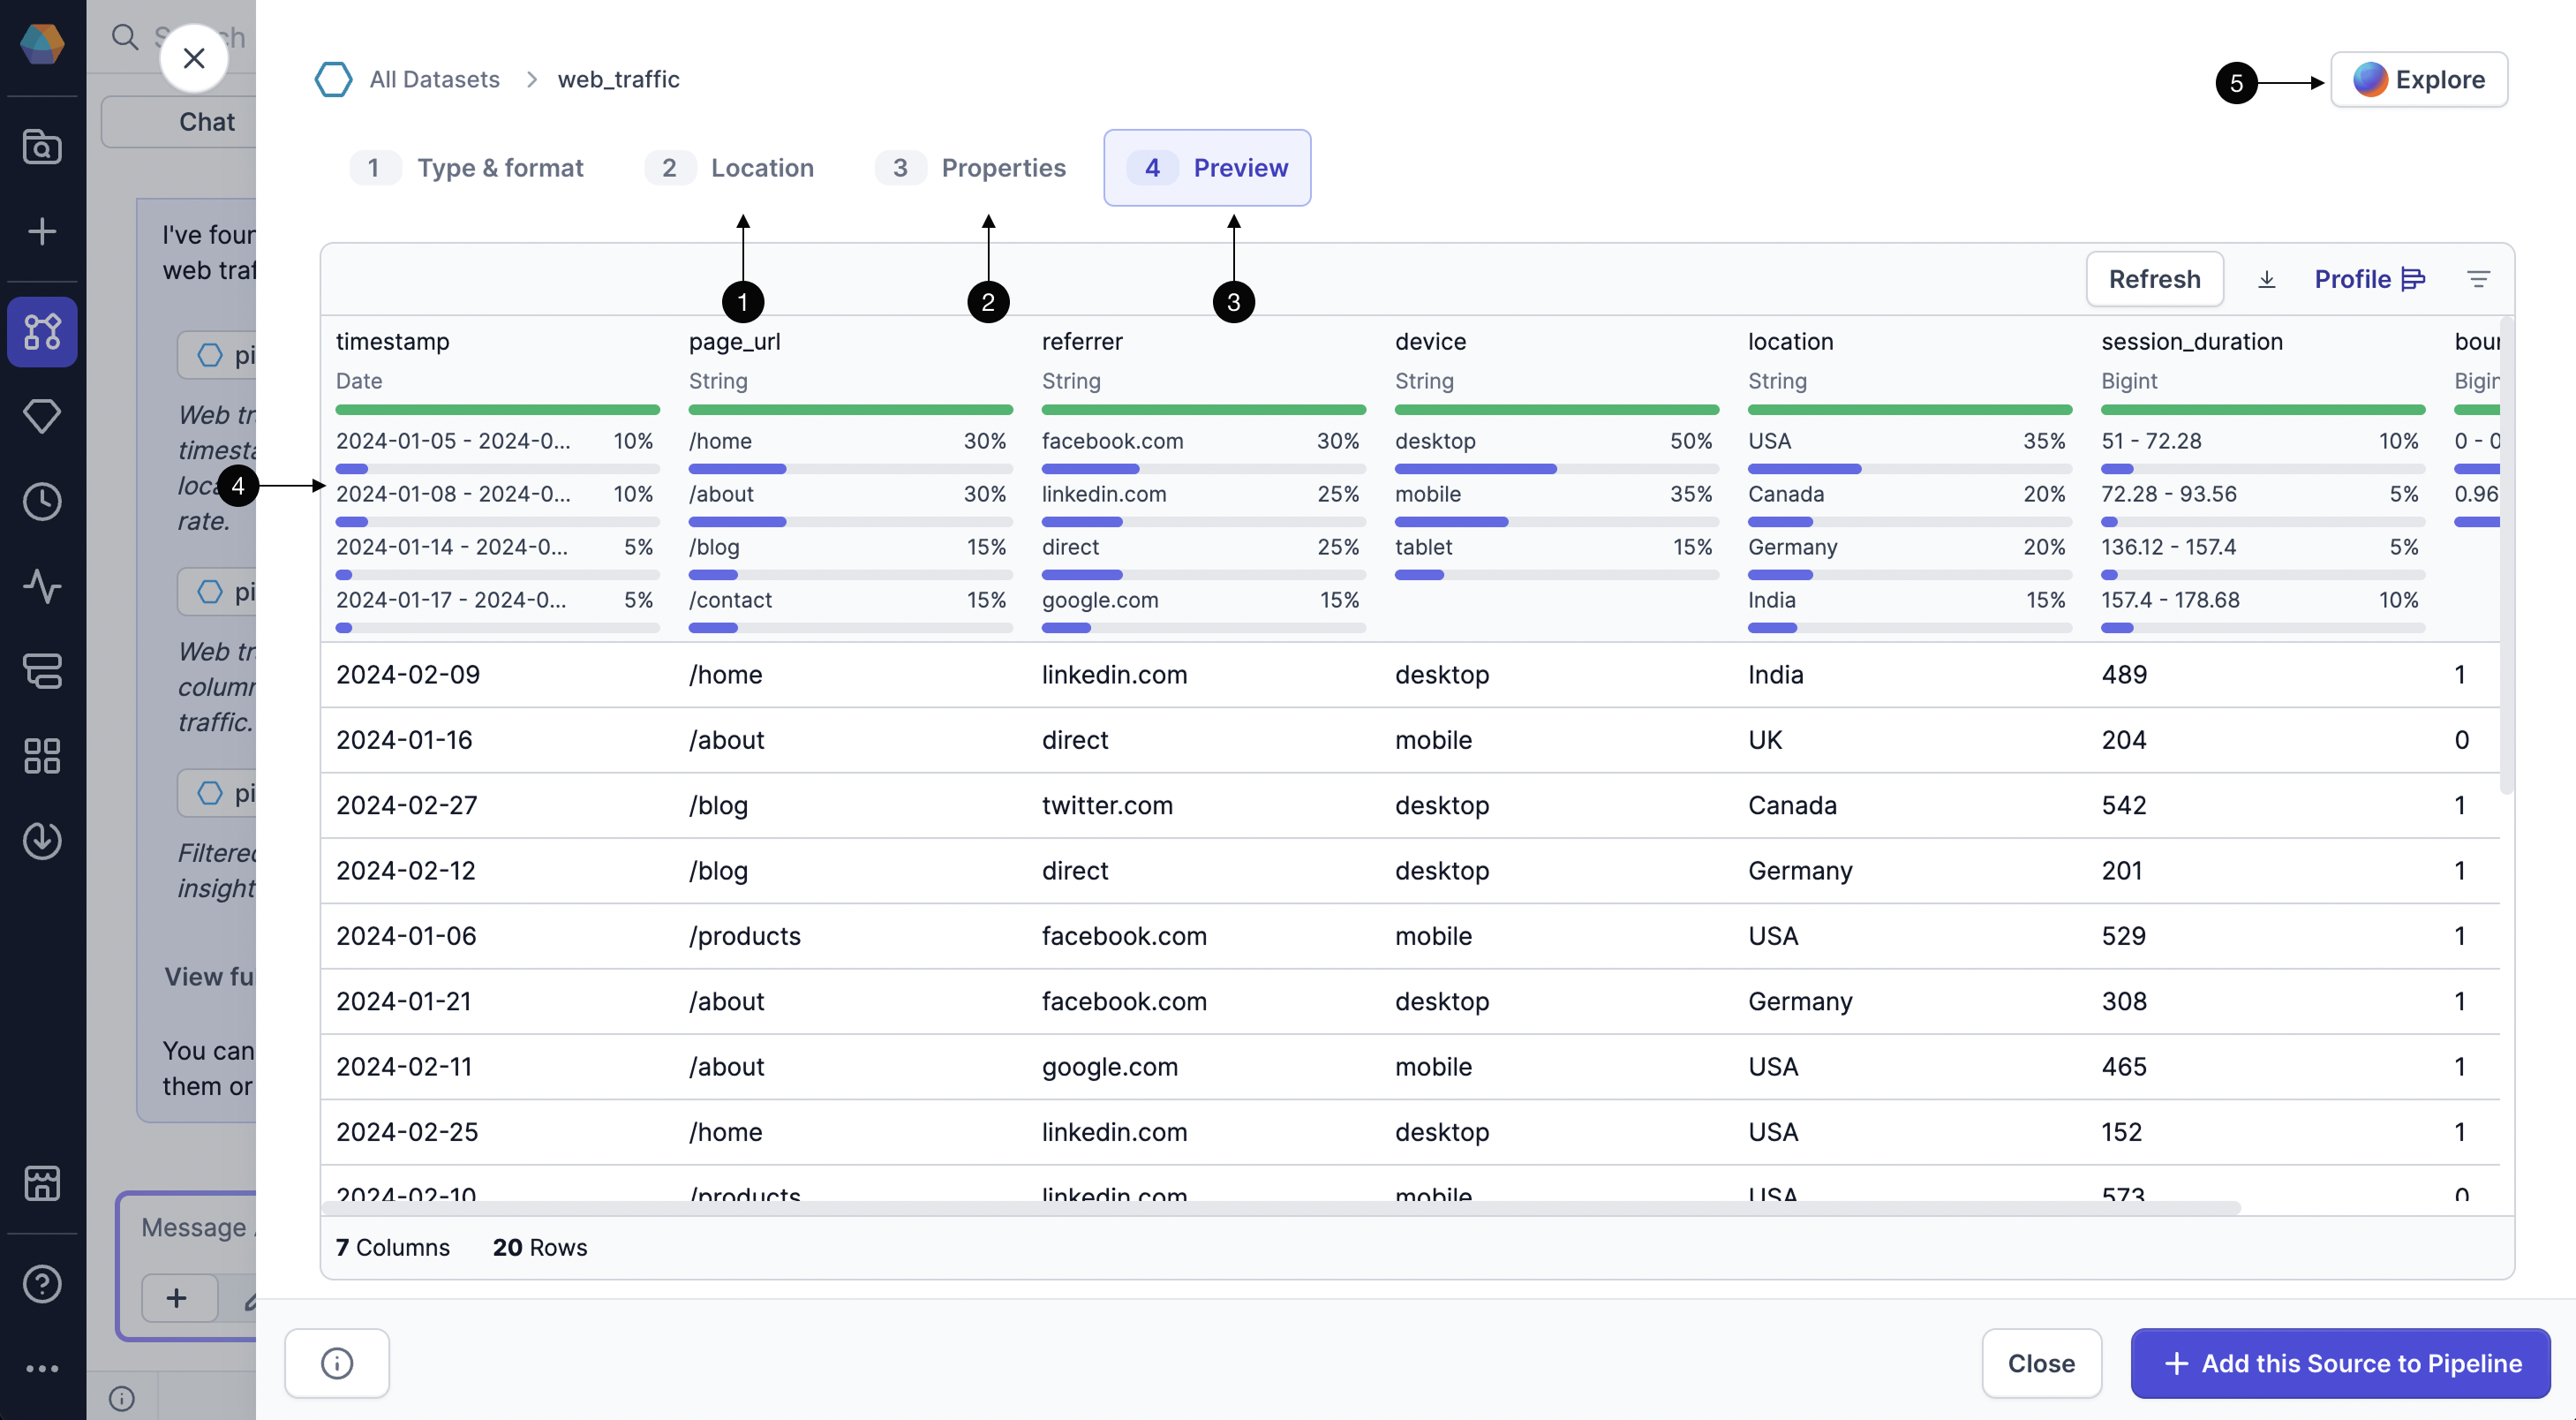
To learn more about a dataset, you can click on it inside the chat. This opens a dialog where you can:
1. Find the location of the dataset in the warehouse.
2. Look over the schema of the dataset.
3. Preview a sample of the data in the dataset.
4. Review the data profile of the sample.
5. Open **Explore** to chat with an Agent that limits responses to the context of the dataset.
 This helps you validate that your data is correct without having to manually browse through your data catalogs.
## Describe a dataset
If you want a summary of dataset information, you can ask the Agent to describe a table.
The Agent will provide a quick overview of key metadata, including the database and schema the table belongs to, as well as the names and data types of each column. This helps you understand the structure of the dataset without having to open or query it directly.
## Compare datasets
If you ask the Agent to compare datasets, you can quickly assess which dataset is more suitable as a source for your pipeline by analyzing differences in schema structure, column names, data types, and size.
This allows you to identify which dataset aligns better with your pipeline's requirements, such as having the right fields, consistent naming conventions, or expected formats, without needing to inspect the full data.
## View sample rows from a table
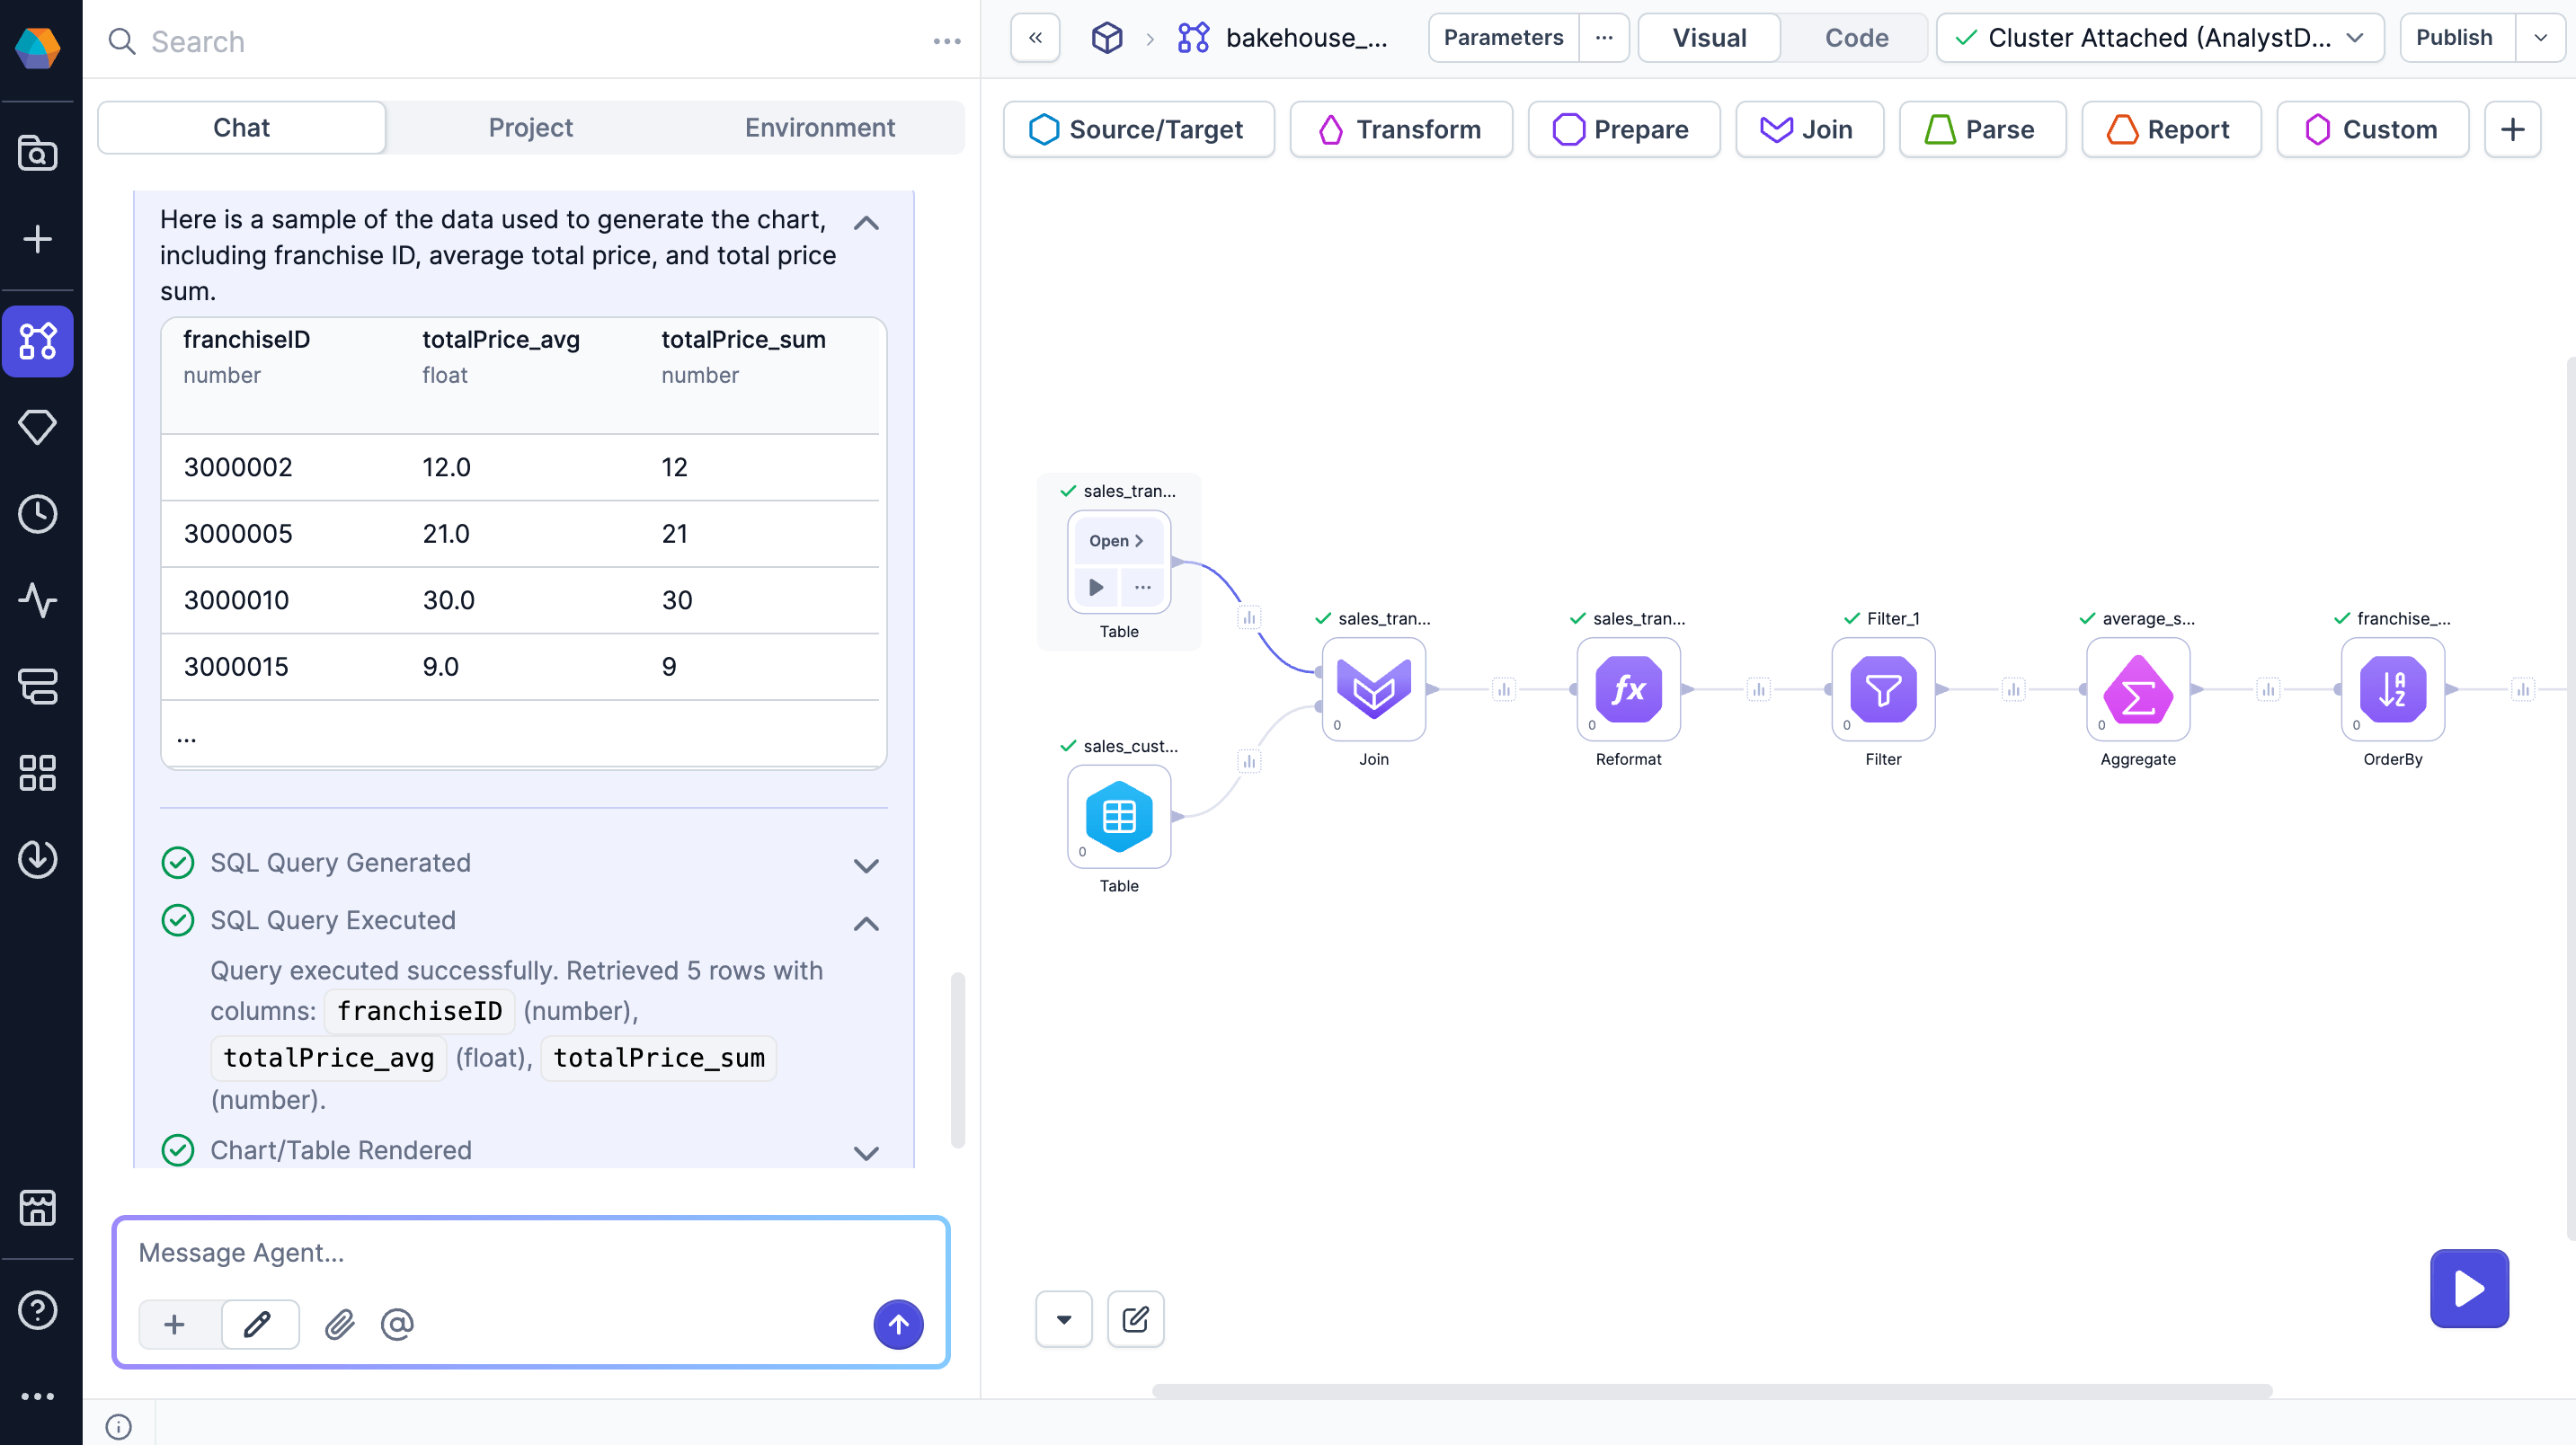
To preview data from a table, ask the Agent to return a sample. You can request a random sample from the table or specific rows, such as "the ten most recent purchases over \$100". All queries are executed under your existing warehouse permissions.
The Agent returns:
* A table showing the sample data.
* A **Preview** option for a closer look.
* SQL execution logs for transparency.
If the dataset isn't already part of your pipeline, you'll also see an option to add it as a Table gem on the canvas.
This helps you validate that your data is correct without having to manually browse through your data catalogs.
## Describe a dataset
If you want a summary of dataset information, you can ask the Agent to describe a table.
The Agent will provide a quick overview of key metadata, including the database and schema the table belongs to, as well as the names and data types of each column. This helps you understand the structure of the dataset without having to open or query it directly.
## Compare datasets
If you ask the Agent to compare datasets, you can quickly assess which dataset is more suitable as a source for your pipeline by analyzing differences in schema structure, column names, data types, and size.
This allows you to identify which dataset aligns better with your pipeline's requirements, such as having the right fields, consistent naming conventions, or expected formats, without needing to inspect the full data.
## View sample rows from a table
To preview data from a table, ask the Agent to return a sample. You can request a random sample from the table or specific rows, such as "the ten most recent purchases over \$100". All queries are executed under your existing warehouse permissions.
The Agent returns:
* A table showing the sample data.
* A **Preview** option for a closer look.
* SQL execution logs for transparency.
If the dataset isn't already part of your pipeline, you'll also see an option to add it as a Table gem on the canvas.
 ### Table preview
Click **Preview** to open a larger view of the data sample. In this view, you can:
* Download the data as a JSON, Excel, or CSV file.
* Show or hide columns.
* Add the full dataset to the canvas (if not present already).
## Visualize table data
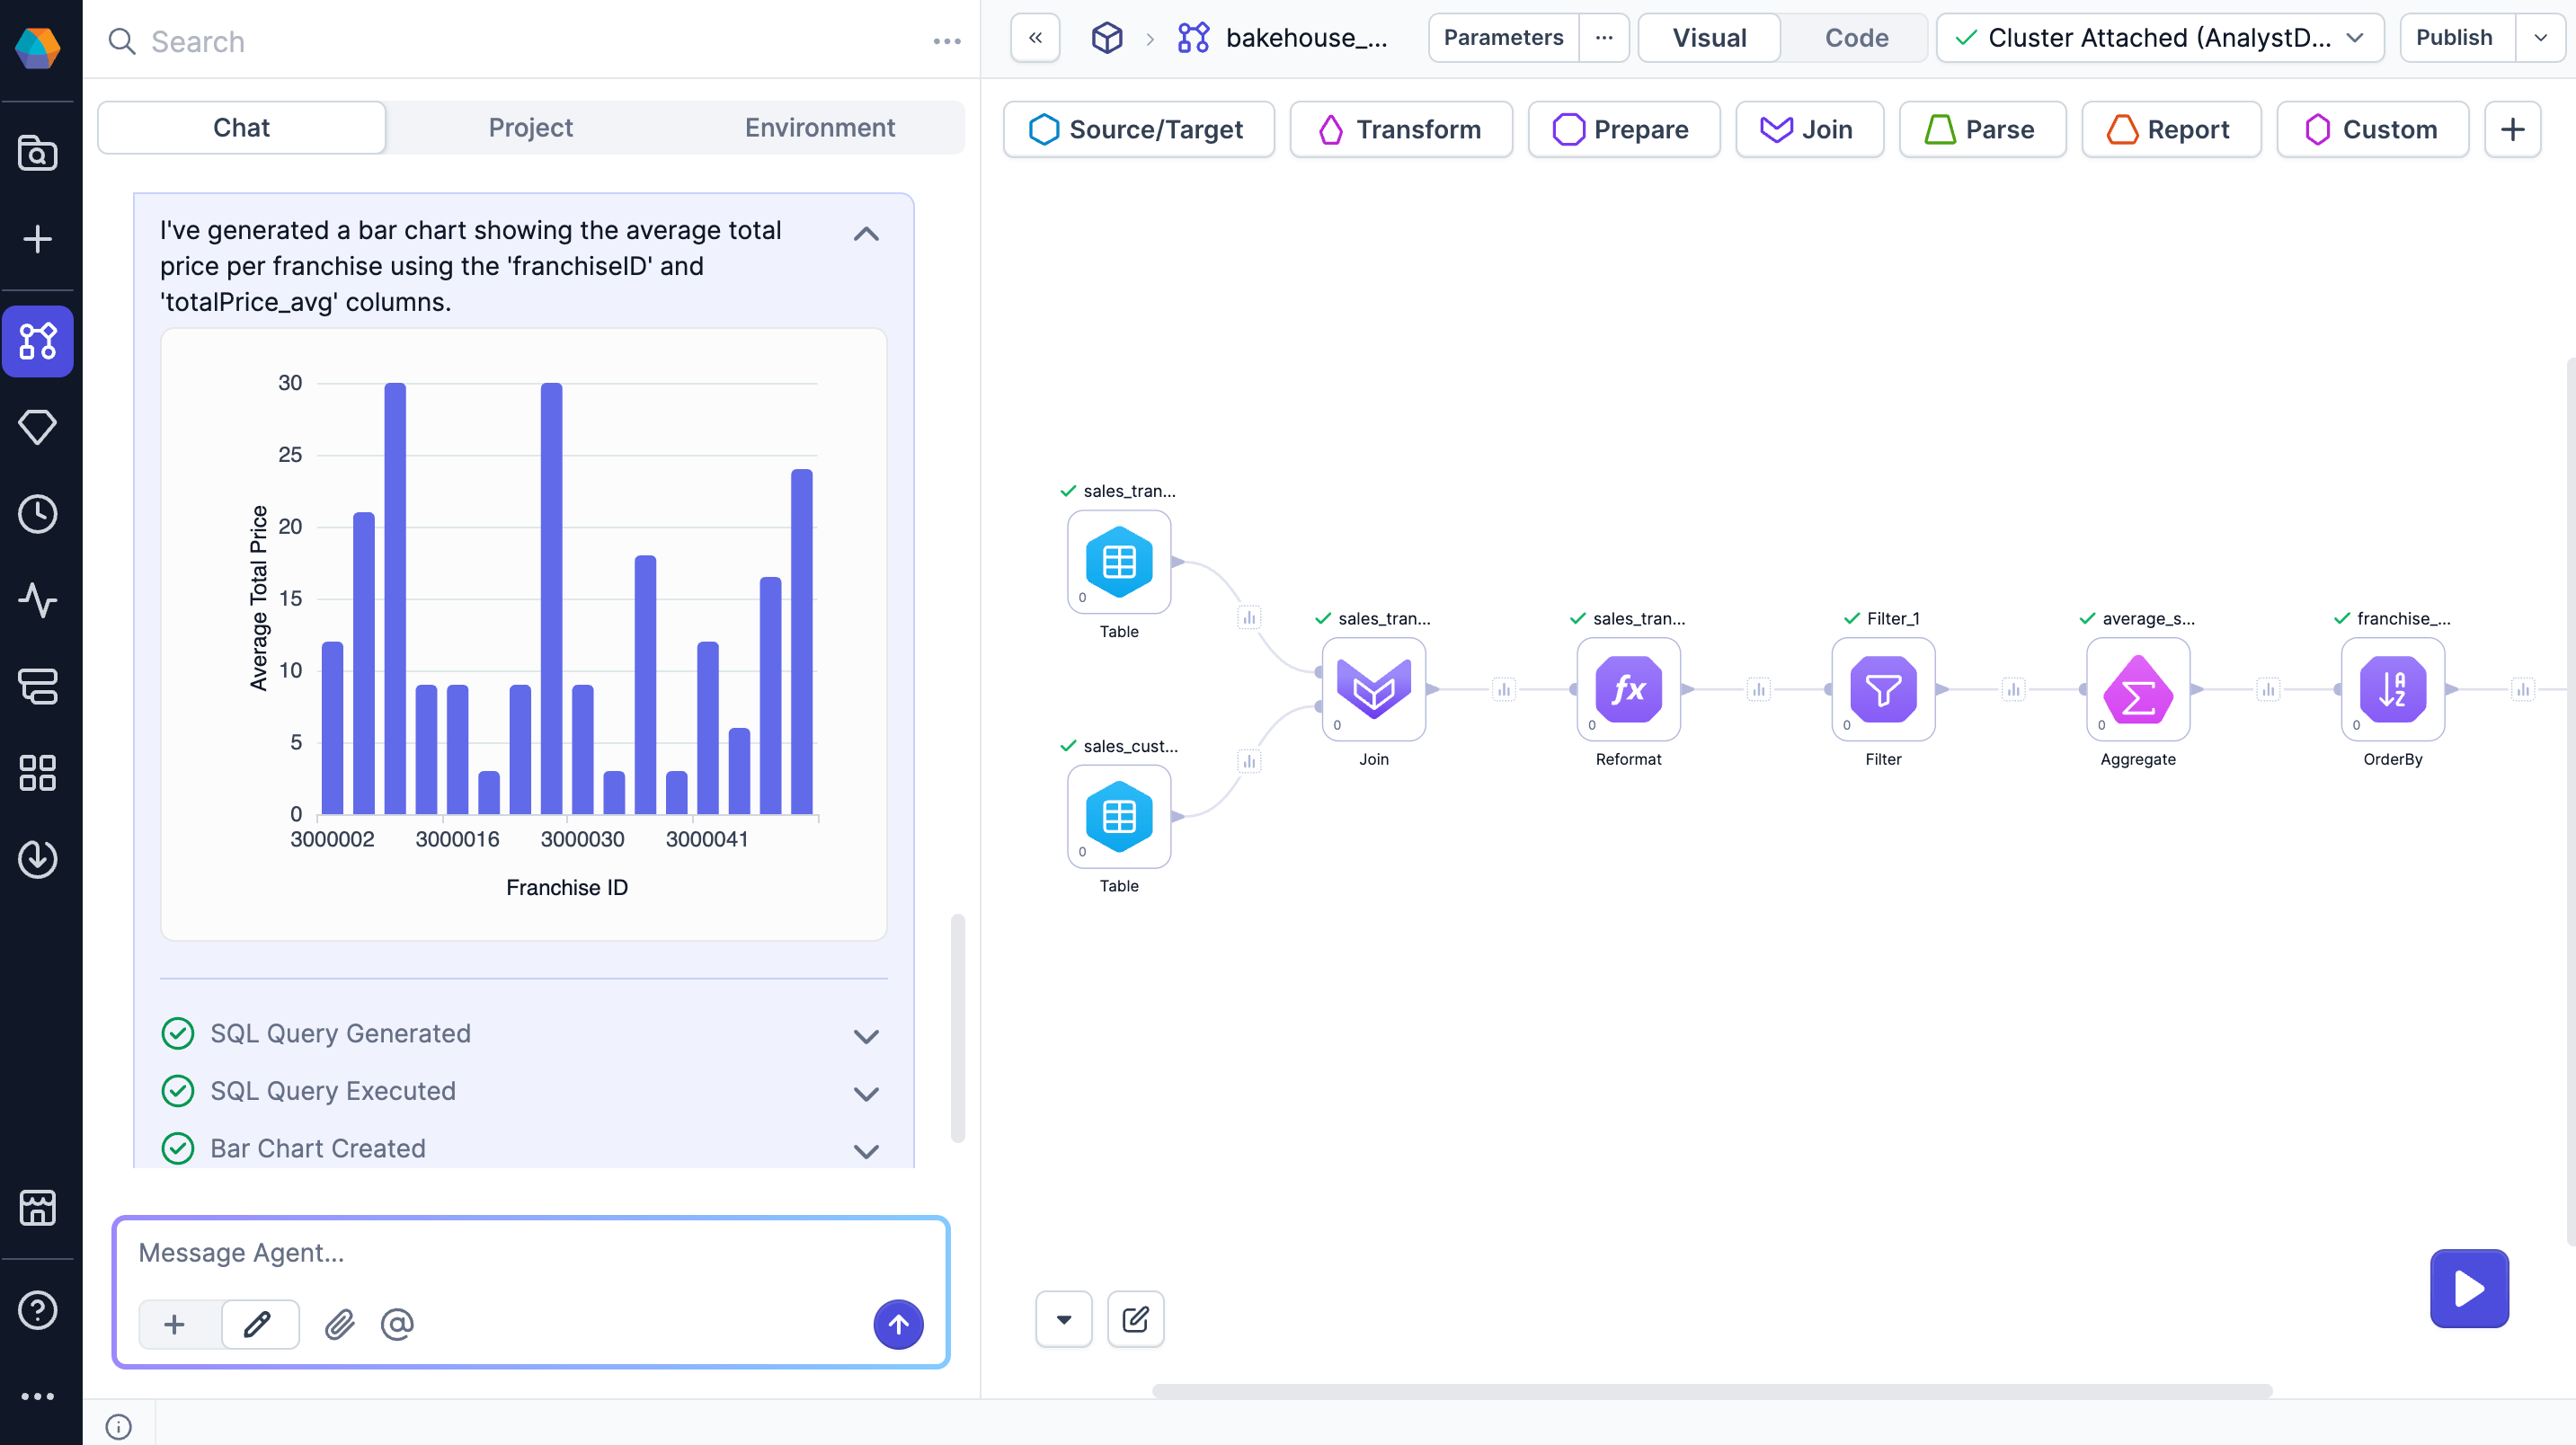
You can also ask the Agent to generate charts for data visualization. The Agent returns:
* An embedded chart directly in the chat.
* A Preview button to open a detailed view.
* SQL execution logs showing how the chart was generated.
If the chart is based on a dataset that isn't yet in your pipeline, you'll see an option to add it as a Table gem.
### Table preview
Click **Preview** to open a larger view of the data sample. In this view, you can:
* Download the data as a JSON, Excel, or CSV file.
* Show or hide columns.
* Add the full dataset to the canvas (if not present already).
## Visualize table data
You can also ask the Agent to generate charts for data visualization. The Agent returns:
* An embedded chart directly in the chat.
* A Preview button to open a detailed view.
* SQL execution logs showing how the chart was generated.
If the chart is based on a dataset that isn't yet in your pipeline, you'll see an option to add it as a Table gem.
 ### Chart preview
To see a larger version of the chart, click **Preview**. This opens the data visualization dialog, which has two tabs.
| Tab | Available actions |
| ------------- | ------------------------------------------------------------------------------------------------------------------------------- |
| Visualization |
### Chart preview
To see a larger version of the chart, click **Preview**. This opens the data visualization dialog, which has two tabs.
| Tab | Available actions |
| ------------- | ------------------------------------------------------------------------------------------------------------------------------- |
| Visualization | - View a larger version of the chart
- Download the chart as an image
- Copy the chart as an image
|
| Data | - View the underlying data
- Download the data as a JSON, Excel, or CSV file
- Show or hide columns
|
To learn more about data visualization, see
[Charts](/data-analysis/development/runs/data-explorer/charts/charts).
## Sample prompts
Here are some sample prompts that you can ask to search, explore, and learn about the data.
| Scenario | Prompt |
| ---------------- | --------------------------------------------------------------------- |
| Find dataset | "Find the dataset that shows employee hiring information and history" |
| View data sample | "Return the top ten highest sales from `@daily_orders`" |
| Describe dataset | "Give me more details about `@revenue_opportunities`" |
| Visualize data | "Plot the sales by country" |
## Troubleshooting
The Agent depends on a [knowledge graph](/data-analysis/ai/knowledge-graph/knowledge-graph) to retrieve metadata about components like datasets. If the Agent does not recognize a table that you try to reference, it could be because the knowledge graph has not been indexed recently enough to capture the dataset.
For detailed instructions on indexing, see [Knowledge graph indexer](/data-analysis/ai/knowledge-graph/indexer).