> ## Documentation Index
> Fetch the complete documentation index at: https://docs.prophecy.ai/llms.txt
> Use this file to discover all available pages before exploring further.
# Create an analysis
> Create and build an analysis dashboard using the Agent or manually
An analysis is an interactive business application built on top of a data pipeline.
Analyses let teams expose pipeline logic through forms, charts, and other interactive components so users can run and consume data without writing code.
When a user runs an analysis, Prophecy executes the underlying pipeline using the values entered in the analysis UI.
## How analyses work
An analysis acts as a UI layer on top of a data pipeline.
The general workflow is:
1. You create an analysis connected to a pipeline.
2. Interactive components are bound to pipeline parameters.
3. Users enter values in the analysis UI.
4. Prophecy executes the pipeline using those values.
5. Results render in charts, tables, and other components.
Analyses support multiple saved configurations. Each configuration stores a reusable set of runtime values and can be run or scheduled independently.
You can enter runtime values in the analysis, which override the pipeline's default parameter values during execution.
## Edit mode and preview mode
Analyses have two primary modes:
* **Edit mode** — Build and configure the analysis layout. Add components, configure charts, and bind inputs to parameters.
* **Preview mode** — Run the analysis as an end user would. Enter runtime values, execute the pipeline, and review the results.
## Overview
Use the Agent to automatically generate a pipeline and analysis from a prompt.
## Add source data
Add a dataset to your pipeline:
1. Open the **Source/Target** gem category.
2. Click **Table**.
3. Open the gem and select **+ New Table**.
4. Choose **Seed** as the type.
5. Name the dataset `home_tech_transactions`.
6. Paste your data and click **Load Data**.
7. Click **Save**.
## Generate an analysis
In the Chat interface, enter a prompt:
```text theme={null}
Visualize sales performance per product category in @home_tech_transactions
```
The Agent will:
* Transform the data.
* Create a visualization.
* Generate a pipeline.
* Generate an interactive analysis dashboard.
## Continue building
You can continue prompting the Agent to:
* Add new visualizations
* Modify transformations
* Expand the dashboard
## Add interactive components
To add interactive components to the analysis, you'll need to embed a pipeline parameter in the pipeline. [Pipeline parameters](/data-analysis/development/parameters/parameters) enable dynamic behavior in pipelines by allowing values to be set at runtime. In this case, pipeline parameter values are set by the end user when they run the analysis.
### Create a pipeline parameter
In this section, you'll define a pipeline parameter called `region`. The parameter will capture the region that the user selects, allowing the pipeline to filter transactions based on the region the user wants to see.
1. Open the pipeline tied to the analysis.
2. Click **default** in the project header to open the parameter settings.
3. Open the **Pipeline Parameters** tab.
4. In the default parameter set, click **+ Add Parameter**.
5. Name the parameter `region`.
6. Set the parameter type to `String`.
7. Click **Select expression > Value**.
8. Enter `North` as the default value to be used during [interactive pipeline runs](/data-analysis/development/runs/execution).
9. Click **Save**.
### Add a filter
Next, add a Filter gem to the pipeline. To make the filter condition dynamic, you'll use the pipeline parameter in the gem.
1. Add a **Filter** gem directly after the Source gem and before the next gem (generated by the Agent).
2. Open the **Filter** gem configuration.
3. For the filter condition:
* Click **Select expression > Column** and select the `Region` column.
* Click **Select operator** and select **equals**.
* Click **Select expression > Configuration Variable** and select the `region` parameter.
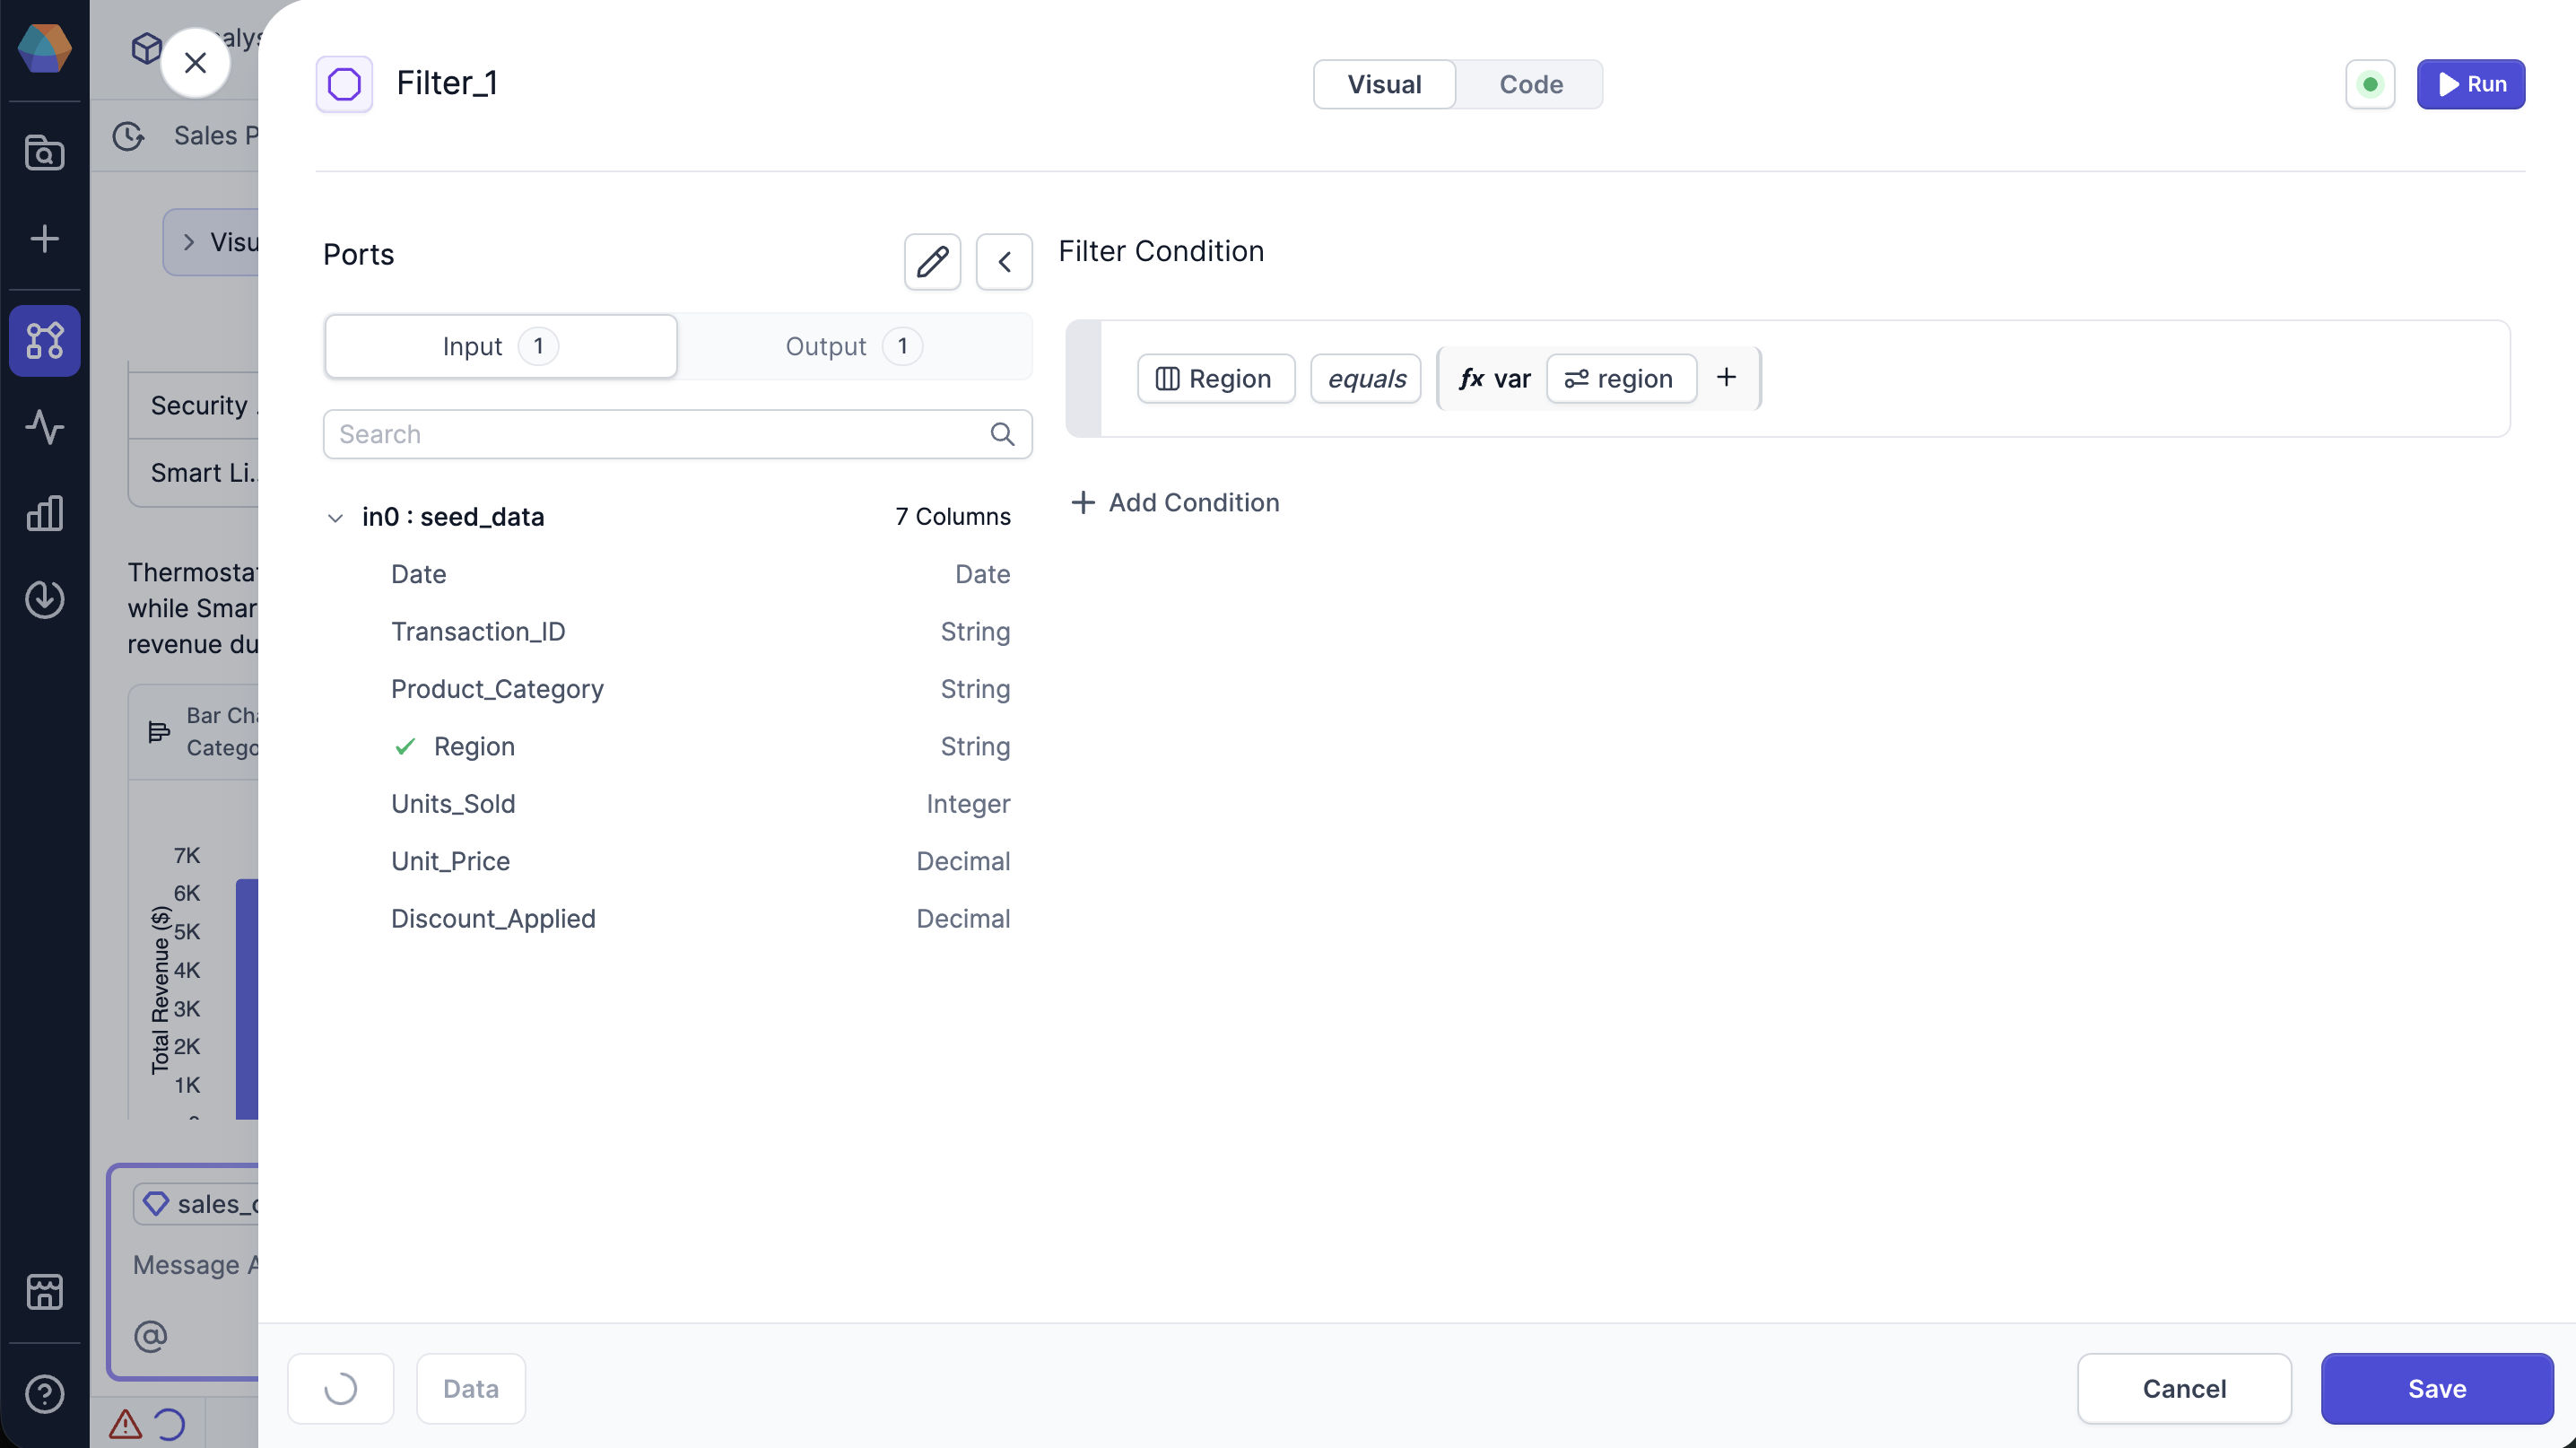 This expression is equivalent to `Region = {{ var('region') }}` in the Code view.
4. Click **Save**.
### Add a Text Input component
Add a Text Input component to allow the end user to enter the region they want to see.
1. Open the analysis dashboard that the Agent created.
2. Click **Edit**.
3. Open the **Interactive** dropdown and select **Text Input**.
4. In the **Inspect** tab, for the **Configuration field**, select the `region` parameter.
5. For the **Label**, enter `Region`.
6. Drag the Text Input component above the bar chart visualization.
For full configuration options, see [Analysis components](/data-analysis/analysis/analysis-components).
## Overview
Create an analysis manually to build a dashboard from an existing pipeline.
## Add source data
Add a dataset to your pipeline:
1. Open the **Source/Target** gem category.
2. Click **Table**.
3. Open the gem and select **+ New Table**.
4. Choose **Seed** as the type.
5. Name the dataset `home_tech_transactions`.
6. Paste your data and click **Load Data**.
7. Click **Save**.
## Create the analysis
1. Open the **Project Browser**.
2. Hover over a pipeline.
3. Click the **Create analysis** icon.
Alternatively:
* Click the **+** icon in the canvas header
* Select **Create analysis**
## Configure the analysis
1. Enter a name for the analysis in **Analysis name**. Use alphanumeric characters and underscores.
2. (Optional) Enter a description in **Description**.
3. Select a pipeline in **Pipeline name**.
4. Choose a parameter set in **Parameter set**.
5. (Optional) Update the location in **Directory path**, or leave the default.
6. Click **Create analysis**.
## Build your analysis
The analysis opens in **Edit** mode on the analysis canvas, where you can design the runtime experience for users.
You can add three types of components:
* **Interactive** — Capture user input
* **Data Integration** — Display pipeline data
* **Content** — Add text and images
For full configuration options, see [Analysis components](/data-analysis/analysis/analysis-components).
## Add a chart
To add a visualization:
1. Select a **chart** component.
2. Choose a **data table**.
3. Enter a **label**.
4. Select a **chart type**.
5. Configure:
* Category column
* Y-axis column
You can further customize chart appearance, including labels and formatting.
## Add interactive components
To add interactive components to the analysis, you'll need to embed a pipeline parameter in the pipeline. [Pipeline parameters](/data-analysis/development/parameters/parameters) enable dynamic behavior in pipelines by allowing values to be set at runtime. In this case, pipeline parameter values are set by the end user when they run the analysis.
### Create a pipeline parameter
In this section, you'll define a pipeline parameter called `region`. The parameter will capture the region that the user selects, allowing the pipeline to filter transactions based on the region the user wants to see.
1. Open the pipeline tied to the analysis.
2. Click **default** in the project header to open the parameter settings.
3. Open the **Pipeline Parameters** tab.
4. In the default parameter set, click **+ Add Parameter**.
5. Name the parameter `region`.
6. Set the parameter type to `String`.
7. Click **Select expression > Value**.
8. Enter `North` as the default value to be used during [interactive pipeline runs](/data-analysis/development/runs/execution).
9. Click **Save**.
### Add a filter
Next, add a Filter gem to the pipeline. To make the filter condition dynamic, you'll use the pipeline parameter in the gem.
1. Add a **Filter** gem directly after the Source gem and before the next gem (generated by the Agent).
2. Open the **Filter** gem configuration.
3. For the filter condition:
* Click **Select expression > Column** and select the `Region` column.
* Click **Select operator** and select **equals**.
* Click **Select expression > Configuration Variable** and select the `region` parameter.
This expression is equivalent to `Region = {{ var('region') }}` in the Code view.
4. Click **Save**.
### Add a Text Input component
Add a Text Input component to allow the end user to enter the region they want to see.
1. Open the analysis dashboard that the Agent created.
2. Click **Edit**.
3. Open the **Interactive** dropdown and select **Text Input**.
4. In the **Inspect** tab, for the **Configuration field**, select the `region` parameter.
5. For the **Label**, enter `Region`.
6. Drag the Text Input component above the bar chart visualization.
## Configurations
Analyses support multiple saved configurations. Configurations appear under the analysis in the App Browser.
Each analysis can contain multiple configurations, which can be selected, renamed, scheduled, or run independently.
A configuration is a named set of runtime values for the analysis. Configurations allow teams to create reusable presets for different environments, users, or operational scenarios.
For example, an analysis might include:
* A `production` configuration.
* A `staging` configuration.
* Configurations for different regions or business units.
Each configuration can be run and scheduled independently.
## Run the analysis
Let's return to the analysis preview so we can test the new component.
1. From the analysis, click **Back to Preview**.
2. In the **Region** field, enter `West`.
3. Click the **Run** button.
4. Review the bar chart to see the total sales by product category for the West region.
When the analysis runs, Prophecy always executes the entire underlying pipeline. This means any additional transformations, tables, or other components included in the pipeline will also run, even if they're not exposed in the dashboard. Be mindful of how you design the pipeline to ensure your dashboard triggers only the intended logic.
## Share the analysis
You can share published analyses with other teams for interactive consumption and execution.
Access to analyses is controlled by Prophecy's team-based permission model. If your team owns a project, you have full edit access. This means that you can build, edit, and delete analyses in the project.
If a project is shared with your team, you **cannot** edit any pipeline's or analysis's structure. However, you can **run** analyses from the shared project. This ensures that your data engineering team can share pipelines they developed without exposing them to changes.
To learn more, reference the documentation on [team-based
access](/data-analysis/administration/management/users/access/team-based-access).
## What's next
To address your specific business requirements, leverage more complex [components](/data-analysis/analysis/analysis-components) to construct robust analysis dashboards.
To learn about the end user experience, see [consume analyses](/data-analysis/analysis/consume-analysis).
This expression is equivalent to `Region = {{ var('region') }}` in the Code view.
4. Click **Save**.
### Add a Text Input component
Add a Text Input component to allow the end user to enter the region they want to see.
1. Open the analysis dashboard that the Agent created.
2. Click **Edit**.
3. Open the **Interactive** dropdown and select **Text Input**.
4. In the **Inspect** tab, for the **Configuration field**, select the `region` parameter.
5. For the **Label**, enter `Region`.
6. Drag the Text Input component above the bar chart visualization.
For full configuration options, see [Analysis components](/data-analysis/analysis/analysis-components).
## Overview
Create an analysis manually to build a dashboard from an existing pipeline.
## Add source data
Add a dataset to your pipeline:
1. Open the **Source/Target** gem category.
2. Click **Table**.
3. Open the gem and select **+ New Table**.
4. Choose **Seed** as the type.
5. Name the dataset `home_tech_transactions`.
6. Paste your data and click **Load Data**.
7. Click **Save**.
## Create the analysis
1. Open the **Project Browser**.
2. Hover over a pipeline.
3. Click the **Create analysis** icon.
Alternatively:
* Click the **+** icon in the canvas header
* Select **Create analysis**
## Configure the analysis
1. Enter a name for the analysis in **Analysis name**. Use alphanumeric characters and underscores.
2. (Optional) Enter a description in **Description**.
3. Select a pipeline in **Pipeline name**.
4. Choose a parameter set in **Parameter set**.
5. (Optional) Update the location in **Directory path**, or leave the default.
6. Click **Create analysis**.
## Build your analysis
The analysis opens in **Edit** mode on the analysis canvas, where you can design the runtime experience for users.
You can add three types of components:
* **Interactive** — Capture user input
* **Data Integration** — Display pipeline data
* **Content** — Add text and images
For full configuration options, see [Analysis components](/data-analysis/analysis/analysis-components).
## Add a chart
To add a visualization:
1. Select a **chart** component.
2. Choose a **data table**.
3. Enter a **label**.
4. Select a **chart type**.
5. Configure:
* Category column
* Y-axis column
You can further customize chart appearance, including labels and formatting.
## Add interactive components
To add interactive components to the analysis, you'll need to embed a pipeline parameter in the pipeline. [Pipeline parameters](/data-analysis/development/parameters/parameters) enable dynamic behavior in pipelines by allowing values to be set at runtime. In this case, pipeline parameter values are set by the end user when they run the analysis.
### Create a pipeline parameter
In this section, you'll define a pipeline parameter called `region`. The parameter will capture the region that the user selects, allowing the pipeline to filter transactions based on the region the user wants to see.
1. Open the pipeline tied to the analysis.
2. Click **default** in the project header to open the parameter settings.
3. Open the **Pipeline Parameters** tab.
4. In the default parameter set, click **+ Add Parameter**.
5. Name the parameter `region`.
6. Set the parameter type to `String`.
7. Click **Select expression > Value**.
8. Enter `North` as the default value to be used during [interactive pipeline runs](/data-analysis/development/runs/execution).
9. Click **Save**.
### Add a filter
Next, add a Filter gem to the pipeline. To make the filter condition dynamic, you'll use the pipeline parameter in the gem.
1. Add a **Filter** gem directly after the Source gem and before the next gem (generated by the Agent).
2. Open the **Filter** gem configuration.
3. For the filter condition:
* Click **Select expression > Column** and select the `Region` column.
* Click **Select operator** and select **equals**.
* Click **Select expression > Configuration Variable** and select the `region` parameter.
This expression is equivalent to `Region = {{ var('region') }}` in the Code view.
4. Click **Save**.
### Add a Text Input component
Add a Text Input component to allow the end user to enter the region they want to see.
1. Open the analysis dashboard that the Agent created.
2. Click **Edit**.
3. Open the **Interactive** dropdown and select **Text Input**.
4. In the **Inspect** tab, for the **Configuration field**, select the `region` parameter.
5. For the **Label**, enter `Region`.
6. Drag the Text Input component above the bar chart visualization.
## Configurations
Analyses support multiple saved configurations. Configurations appear under the analysis in the App Browser.
Each analysis can contain multiple configurations, which can be selected, renamed, scheduled, or run independently.
A configuration is a named set of runtime values for the analysis. Configurations allow teams to create reusable presets for different environments, users, or operational scenarios.
For example, an analysis might include:
* A `production` configuration.
* A `staging` configuration.
* Configurations for different regions or business units.
Each configuration can be run and scheduled independently.
## Run the analysis
Let's return to the analysis preview so we can test the new component.
1. From the analysis, click **Back to Preview**.
2. In the **Region** field, enter `West`.
3. Click the **Run** button.
4. Review the bar chart to see the total sales by product category for the West region.
When the analysis runs, Prophecy always executes the entire underlying pipeline. This means any additional transformations, tables, or other components included in the pipeline will also run, even if they're not exposed in the dashboard. Be mindful of how you design the pipeline to ensure your dashboard triggers only the intended logic.
## Share the analysis
You can share published analyses with other teams for interactive consumption and execution.
Access to analyses is controlled by Prophecy's team-based permission model. If your team owns a project, you have full edit access. This means that you can build, edit, and delete analyses in the project.
If a project is shared with your team, you **cannot** edit any pipeline's or analysis's structure. However, you can **run** analyses from the shared project. This ensures that your data engineering team can share pipelines they developed without exposing them to changes.
To learn more, reference the documentation on [team-based
access](/data-analysis/administration/management/users/access/team-based-access).
## What's next
To address your specific business requirements, leverage more complex [components](/data-analysis/analysis/analysis-components) to construct robust analysis dashboards.
To learn about the end user experience, see [consume analyses](/data-analysis/analysis/consume-analysis).