> ## Documentation Index
> Fetch the complete documentation index at: https://docs.prophecy.ai/llms.txt
> Use this file to discover all available pages before exploring further.
# Map chart
> Learn what parameters you need to configure a maker and displacement map chart
A map chart uses a map to show how data is distributed across a geographic region.
Prophecy provides two types of map charts: a [marker map](#marker-map-chart) and a [displacement map](#displacement-map-chart).
The option to select a map chart only appears when the dataset contains geo points in WKT format.
## Marker map chart
A marker map chart uses pins to visually represent each data point on a map.
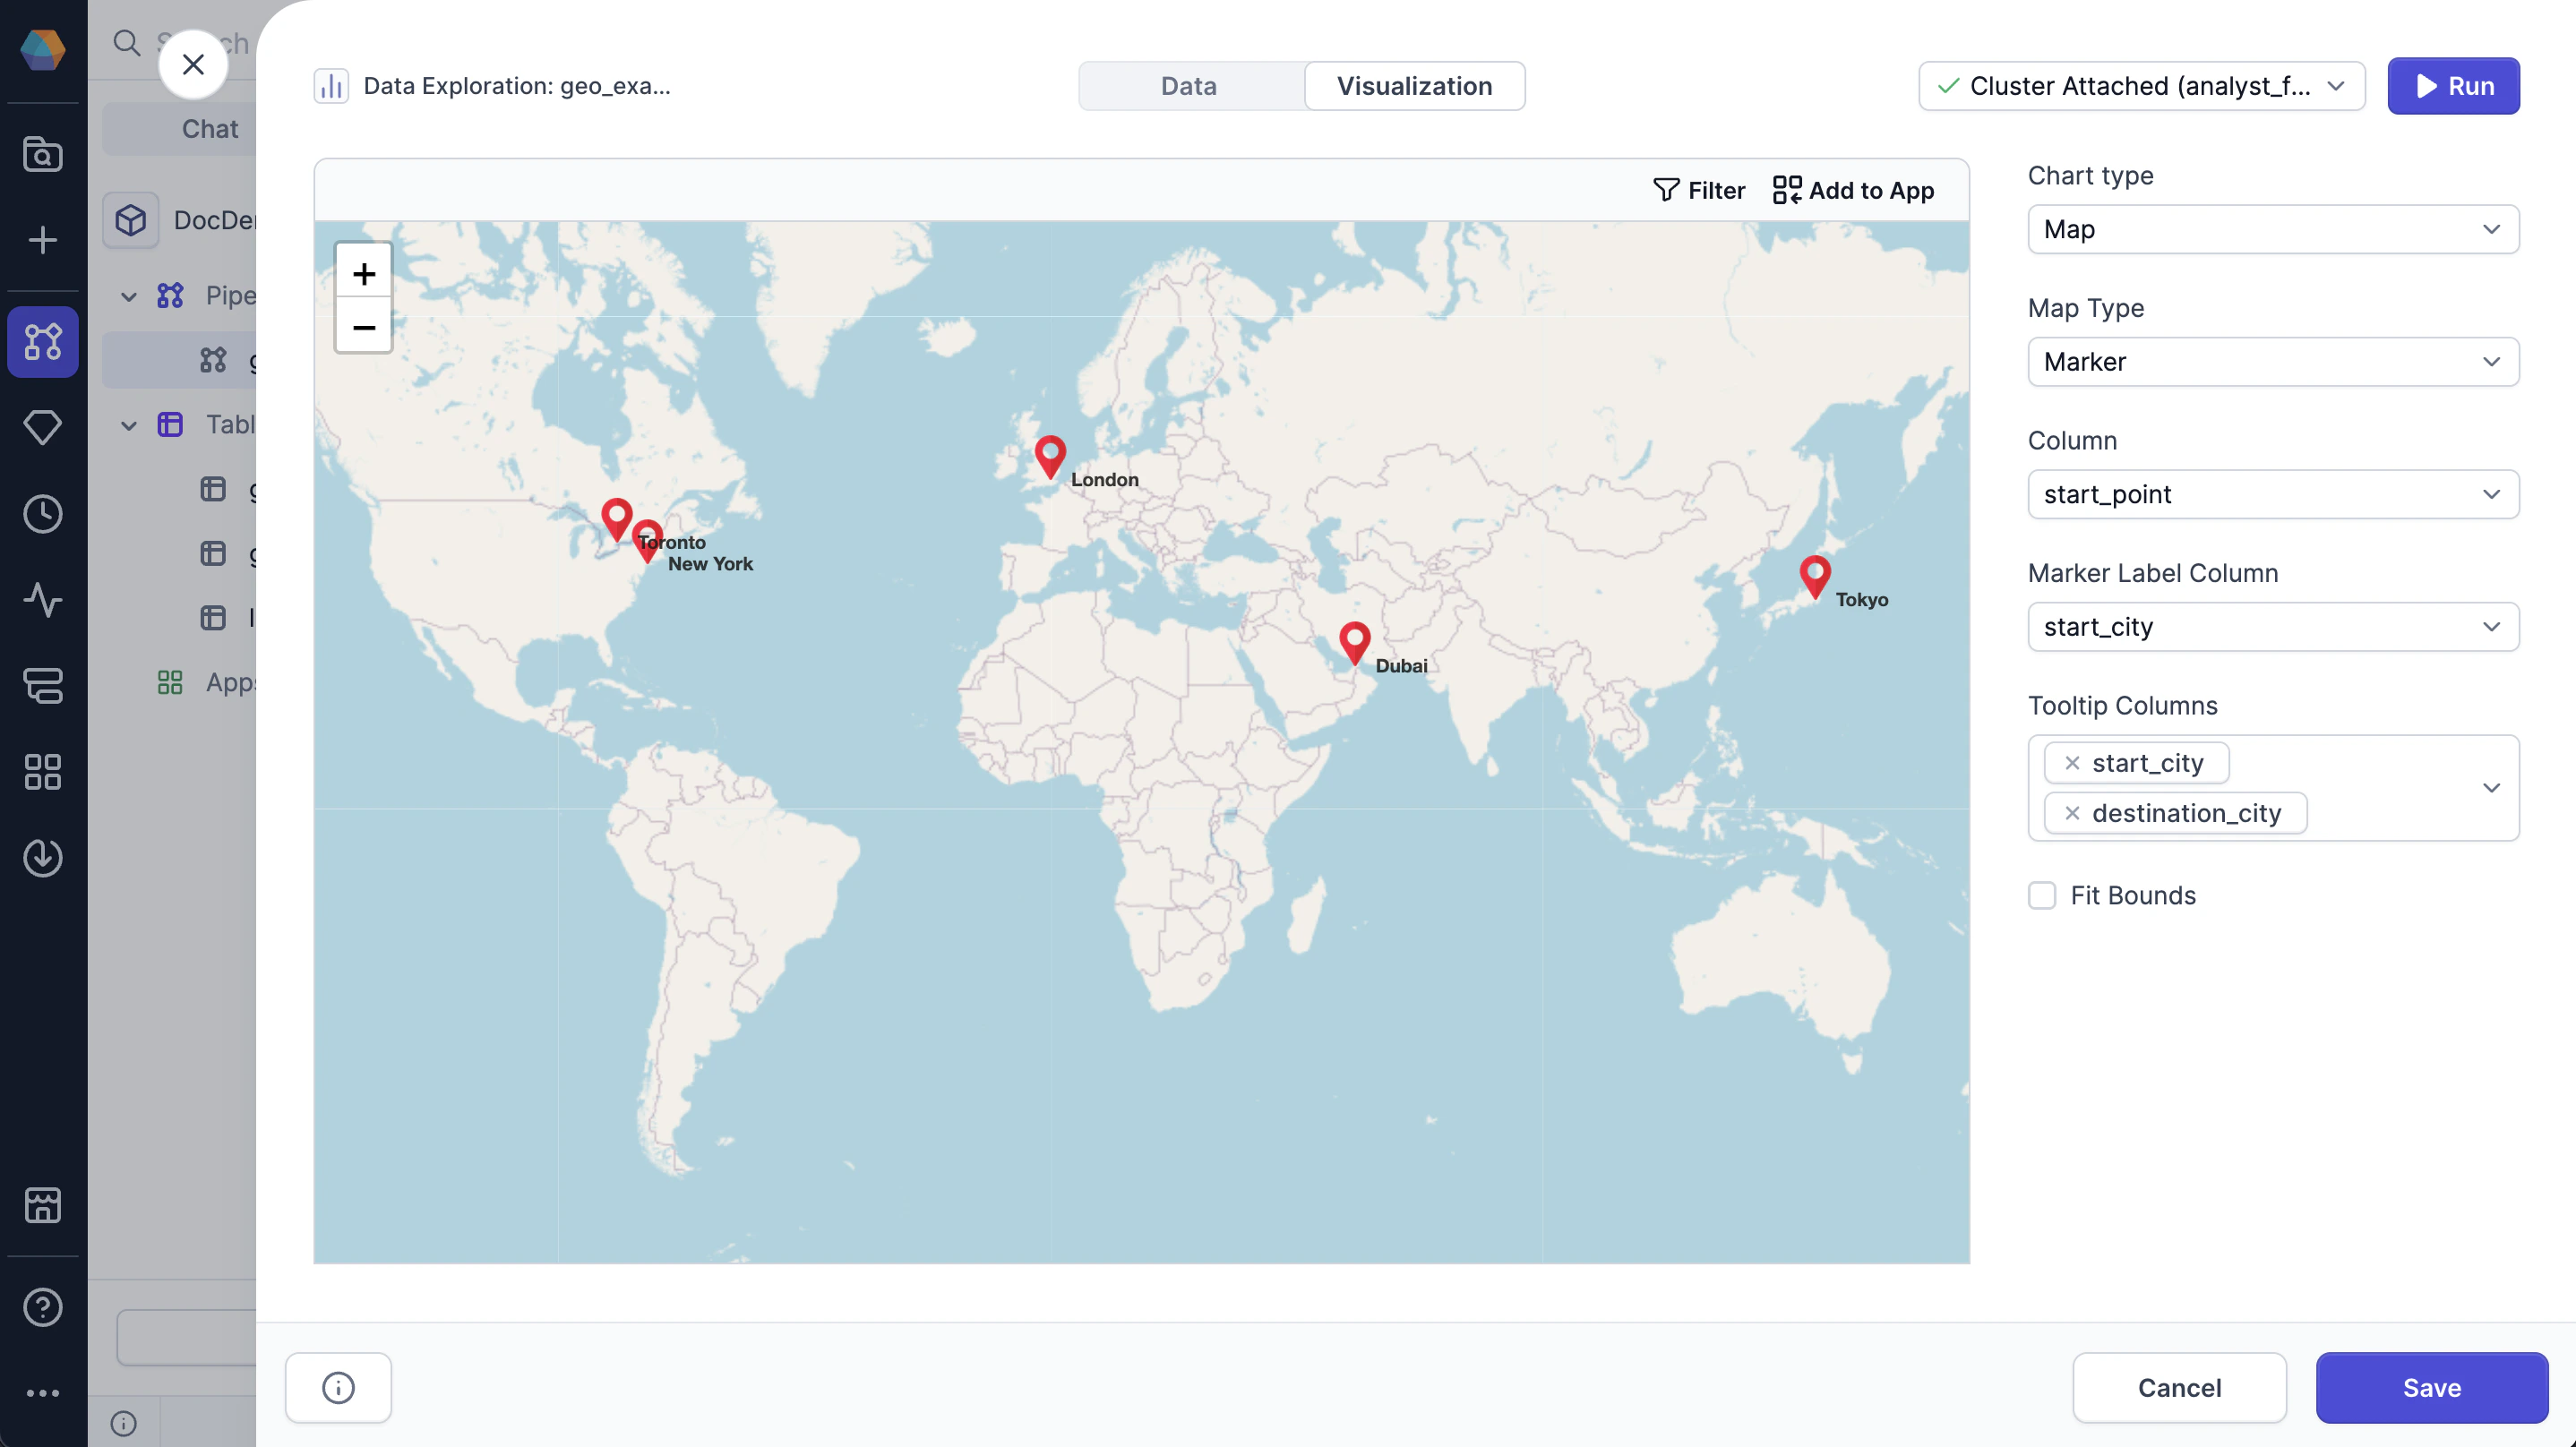 You can configure the following parameters for the chart:
| Parameter | Description |
| ------------------- | ------------------------------------------------------------------------------------ |
| Column | Column that contains geo points in WKT format. |
| Marker Label Column | Column that contains the name of each geo point (for example, a `city_name` column). |
| Tooltip Columns | Column that contains information that will show up in the geo point tooltip. |
| Fit Bounds | Whether to fit the map to the bounds in the points. |
## Displacement map chart
A displacement map chart shows the paths between points on a map.
You can configure the following parameters for the chart:
| Parameter | Description |
| ------------------- | ------------------------------------------------------------------------------------ |
| Column | Column that contains geo points in WKT format. |
| Marker Label Column | Column that contains the name of each geo point (for example, a `city_name` column). |
| Tooltip Columns | Column that contains information that will show up in the geo point tooltip. |
| Fit Bounds | Whether to fit the map to the bounds in the points. |
## Displacement map chart
A displacement map chart shows the paths between points on a map.
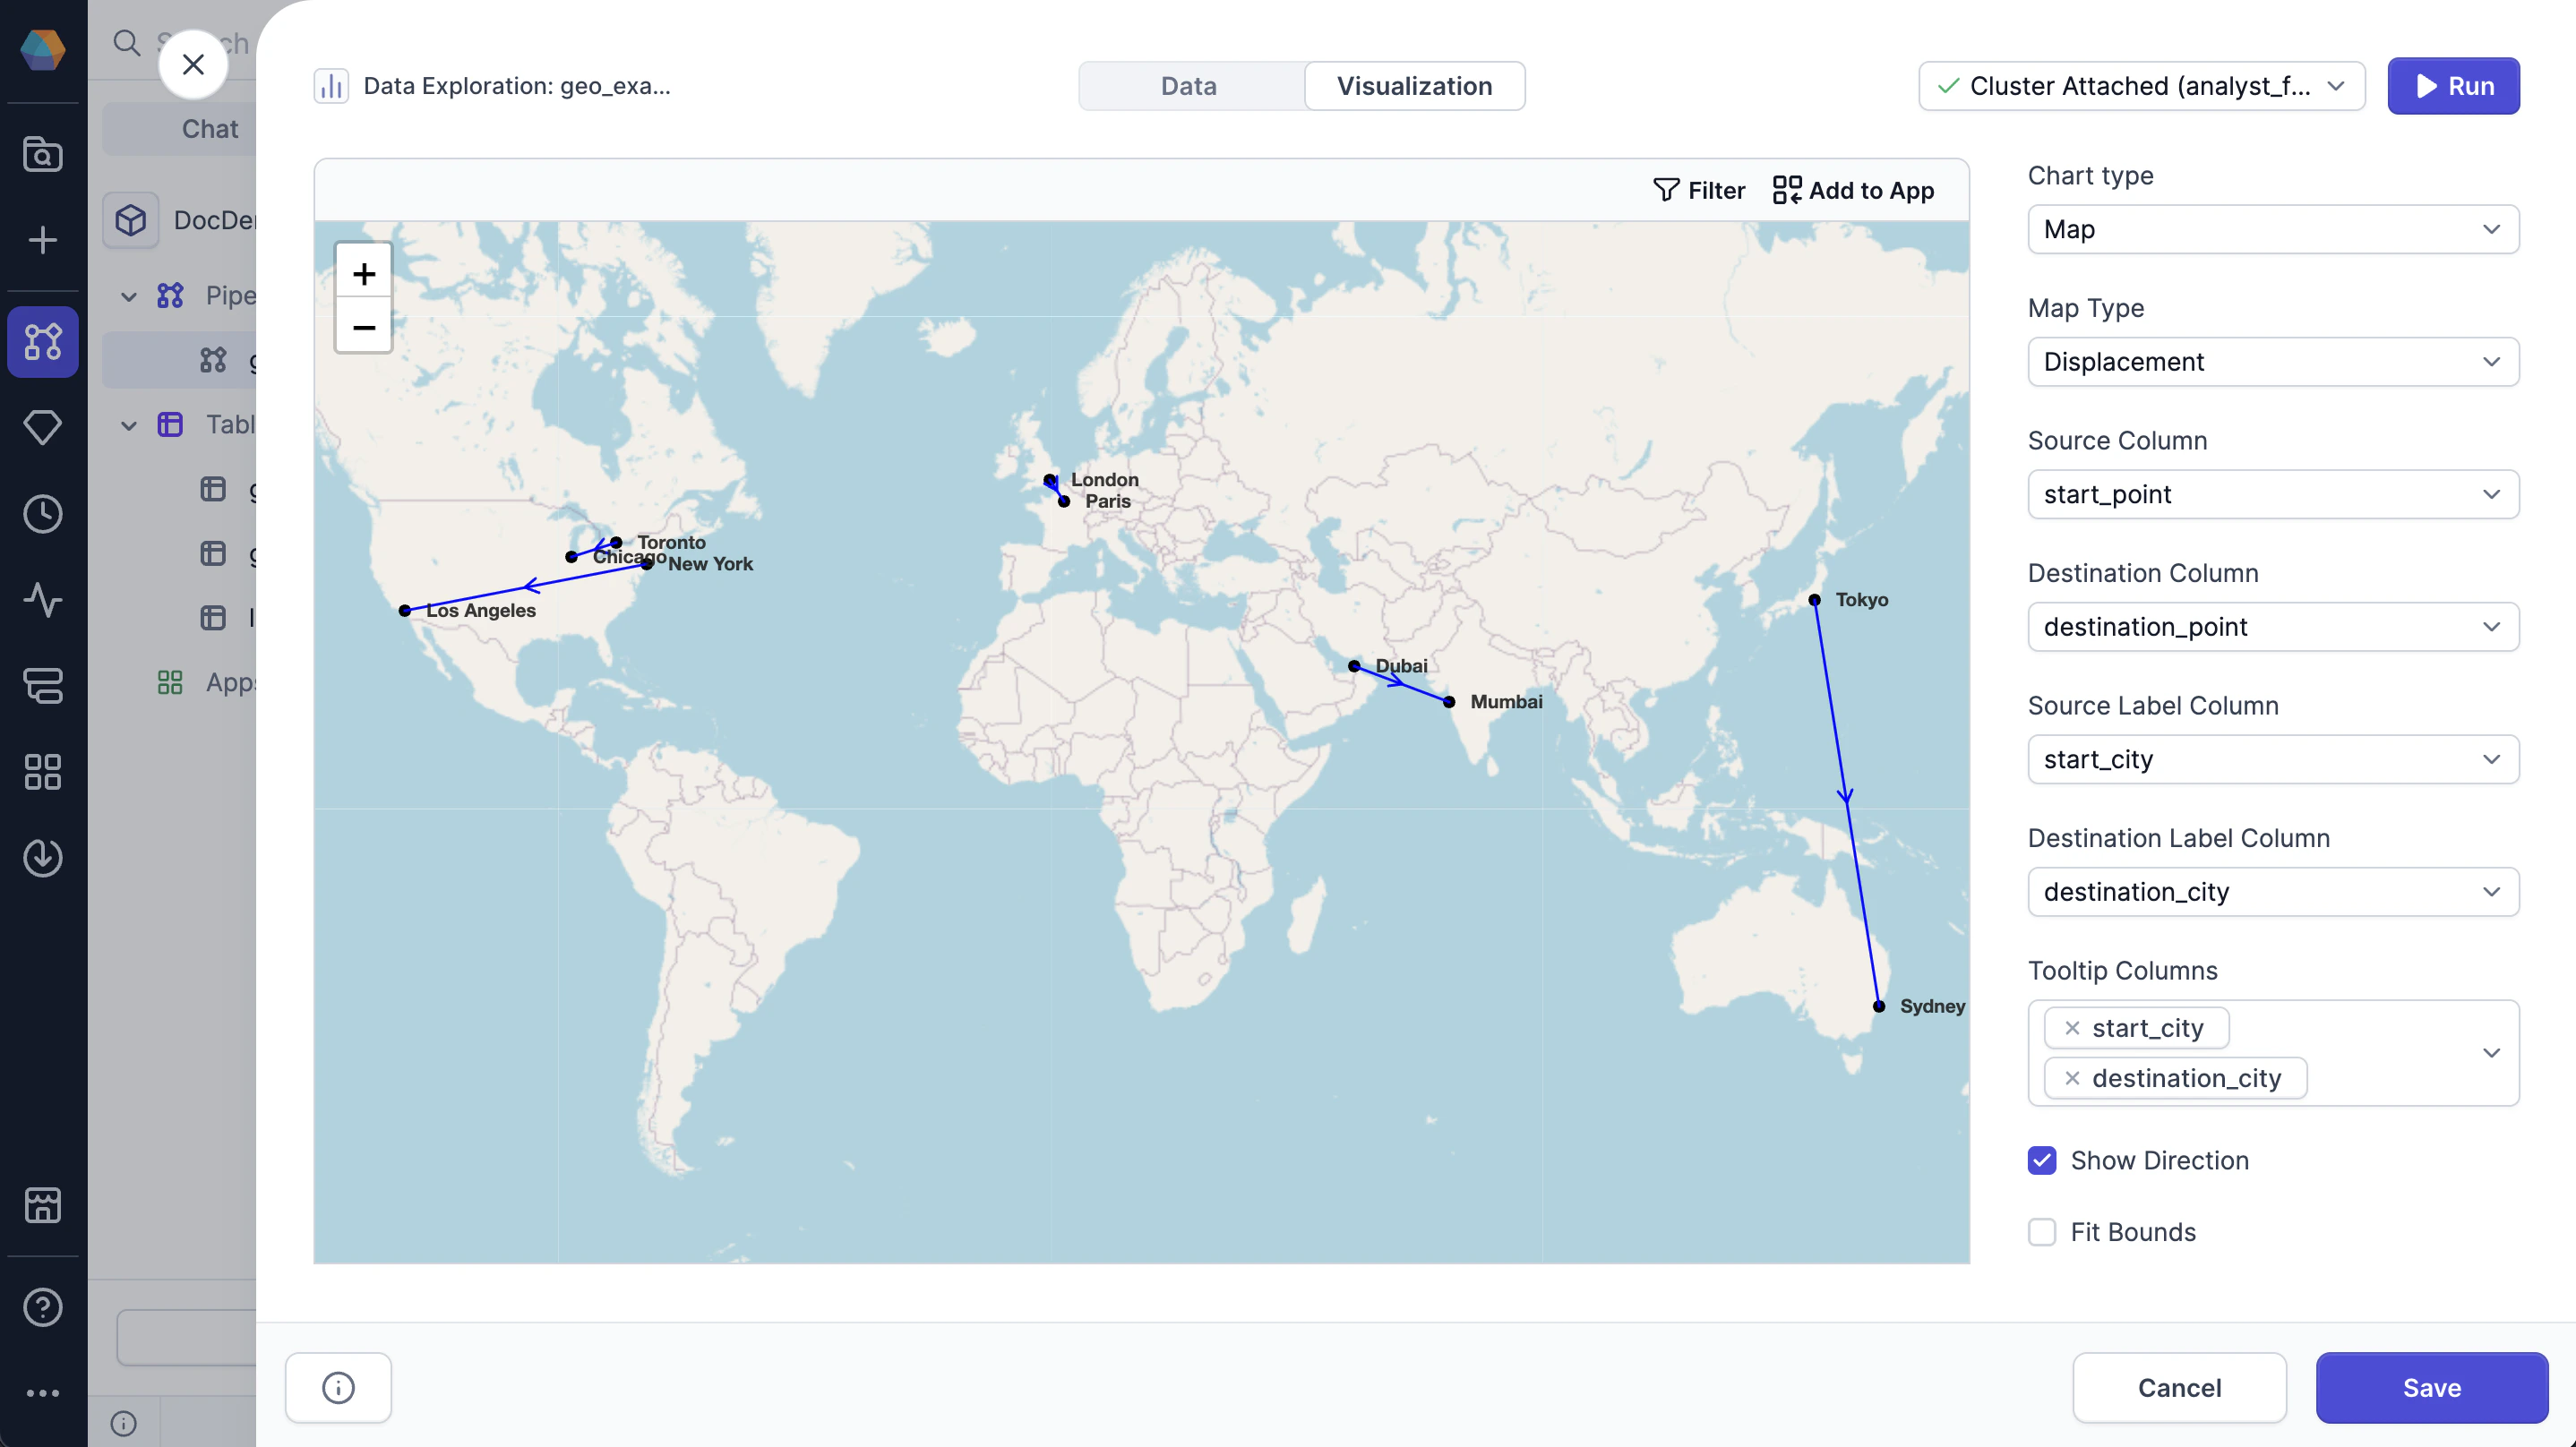 You can configure the following parameters for the chart:
| Parameter | Description |
| ------------------------ | -------------------------------------------------------------------------------------------- |
| Source Column | Column that contains the starting geo points in WKT format for the map. |
| Destination Column | Column that contains the destination geo points in WKT format for the map. |
| Source Label Column | Column that contains an identifier for each starting point. |
| Destination Label Column | Column that contains an identifier for each destination point. |
| Tooltip Columns | Column that contains information that will show up in the geo point tooltip. |
| Show Direction | Whether to include an arrow on that map that indicates direction from source to destination. |
| Fit Bounds | Whether to fit the map to the bounds in the points. |
You can configure the following parameters for the chart:
| Parameter | Description |
| ------------------------ | -------------------------------------------------------------------------------------------- |
| Source Column | Column that contains the starting geo points in WKT format for the map. |
| Destination Column | Column that contains the destination geo points in WKT format for the map. |
| Source Label Column | Column that contains an identifier for each starting point. |
| Destination Label Column | Column that contains an identifier for each destination point. |
| Tooltip Columns | Column that contains information that will show up in the geo point tooltip. |
| Show Direction | Whether to include an arrow on that map that indicates direction from source to destination. |
| Fit Bounds | Whether to fit the map to the bounds in the points. |