> ## Documentation Index
> Fetch the complete documentation index at: https://docs.prophecy.ai/llms.txt
> Use this file to discover all available pages before exploring further.
# Monitoring
> Review your deployed projects, scheduled pipelines, and run history
The **Observability** interface in Prophecy lets you monitor your deployed projects, review scheduled pipelines, and audit run history. You'll be able to view all projects and pipelines that your teams own.
To access, click **Observability** (the line graph icon) in the left sidebar.
## Deployed Projects
The **Deployed Projects** tab in the Observability interface shows all projects that have been [published](/data-analysis/development/versioning/version-control) to Prophecy fabrics. It lets you view details on release versions and recent execution status at the project level.
For each project deployment, Prophecy provides the following information.
| Column | Description |
| ------------------- | --------------------------------------------------------------------------------- |
| **Project** | Name of the deployed project. Click the name to navigate to the project metadata. |
| **Fabric** | Fabric associated with the project deployment. |
| **Release Version** | Version number of the deployed project release. |
| **Published** | Time since the project was last published. |
| **Last Run** | Time since the most recent pipeline execution in the project. |
| **Last Run Status** | Success or failure of the last run. |
Use the following filters to narrow the results:
| Field | Description |
| ------------------ | --------------------------------------------------------------------- |
| **Search project** | Search for a project by name. |
| **Fabric** | Filter results by the fabric (such as `AnalystDBX`, `devDatabricks`). |
When a project is published to multiple fabrics, Prophecy creates an individual project deployment for
each fabric. You will see all of these deployments in the Deployed Projects page. You cannot
revert or delete a project deployment.
## Scheduled Pipelines
The **Scheduled Pipelines** tab in the Observability interface displays all pipelines configured with a schedule across environments. It provides details on pipeline execution frequency and recent run outcomes. Use this page to verify that pipelines are scheduled correctly and to identify patterns of success or failure.
For each scheduled pipeline, Prophecy provides the following information.
| Column | Description |
| --------------- | ----------------------------------------------------------------------------------------------------- |
| **Pipeline** | Name of the pipeline. Click to view the pipeline in the project editor. |
| **Fabric** | Fabric where the pipeline is deployed. |
| **Project** | Project that contains the pipeline. |
| **Triggers** | Type of trigger for the schedule. Schedules can include multiple triggers. |
| **Last 5 Runs** | Status of the 5 most recent runs. To find the history of all pipeline runs, open the Run History tab. |
You may see multiple rows for the same pipeline if the parent project is deployed to multiple
fabrics.
Use the following filters to narrow the results:
| Field | Description |
| ------------------- | ----------------------------------------------------------- |
| **Search pipeline** | Search by pipeline name. |
| **Fabric** | Filter by fabric. |
| **Project** | Filter by the project that contains the scheduled pipeline. |
## Run History
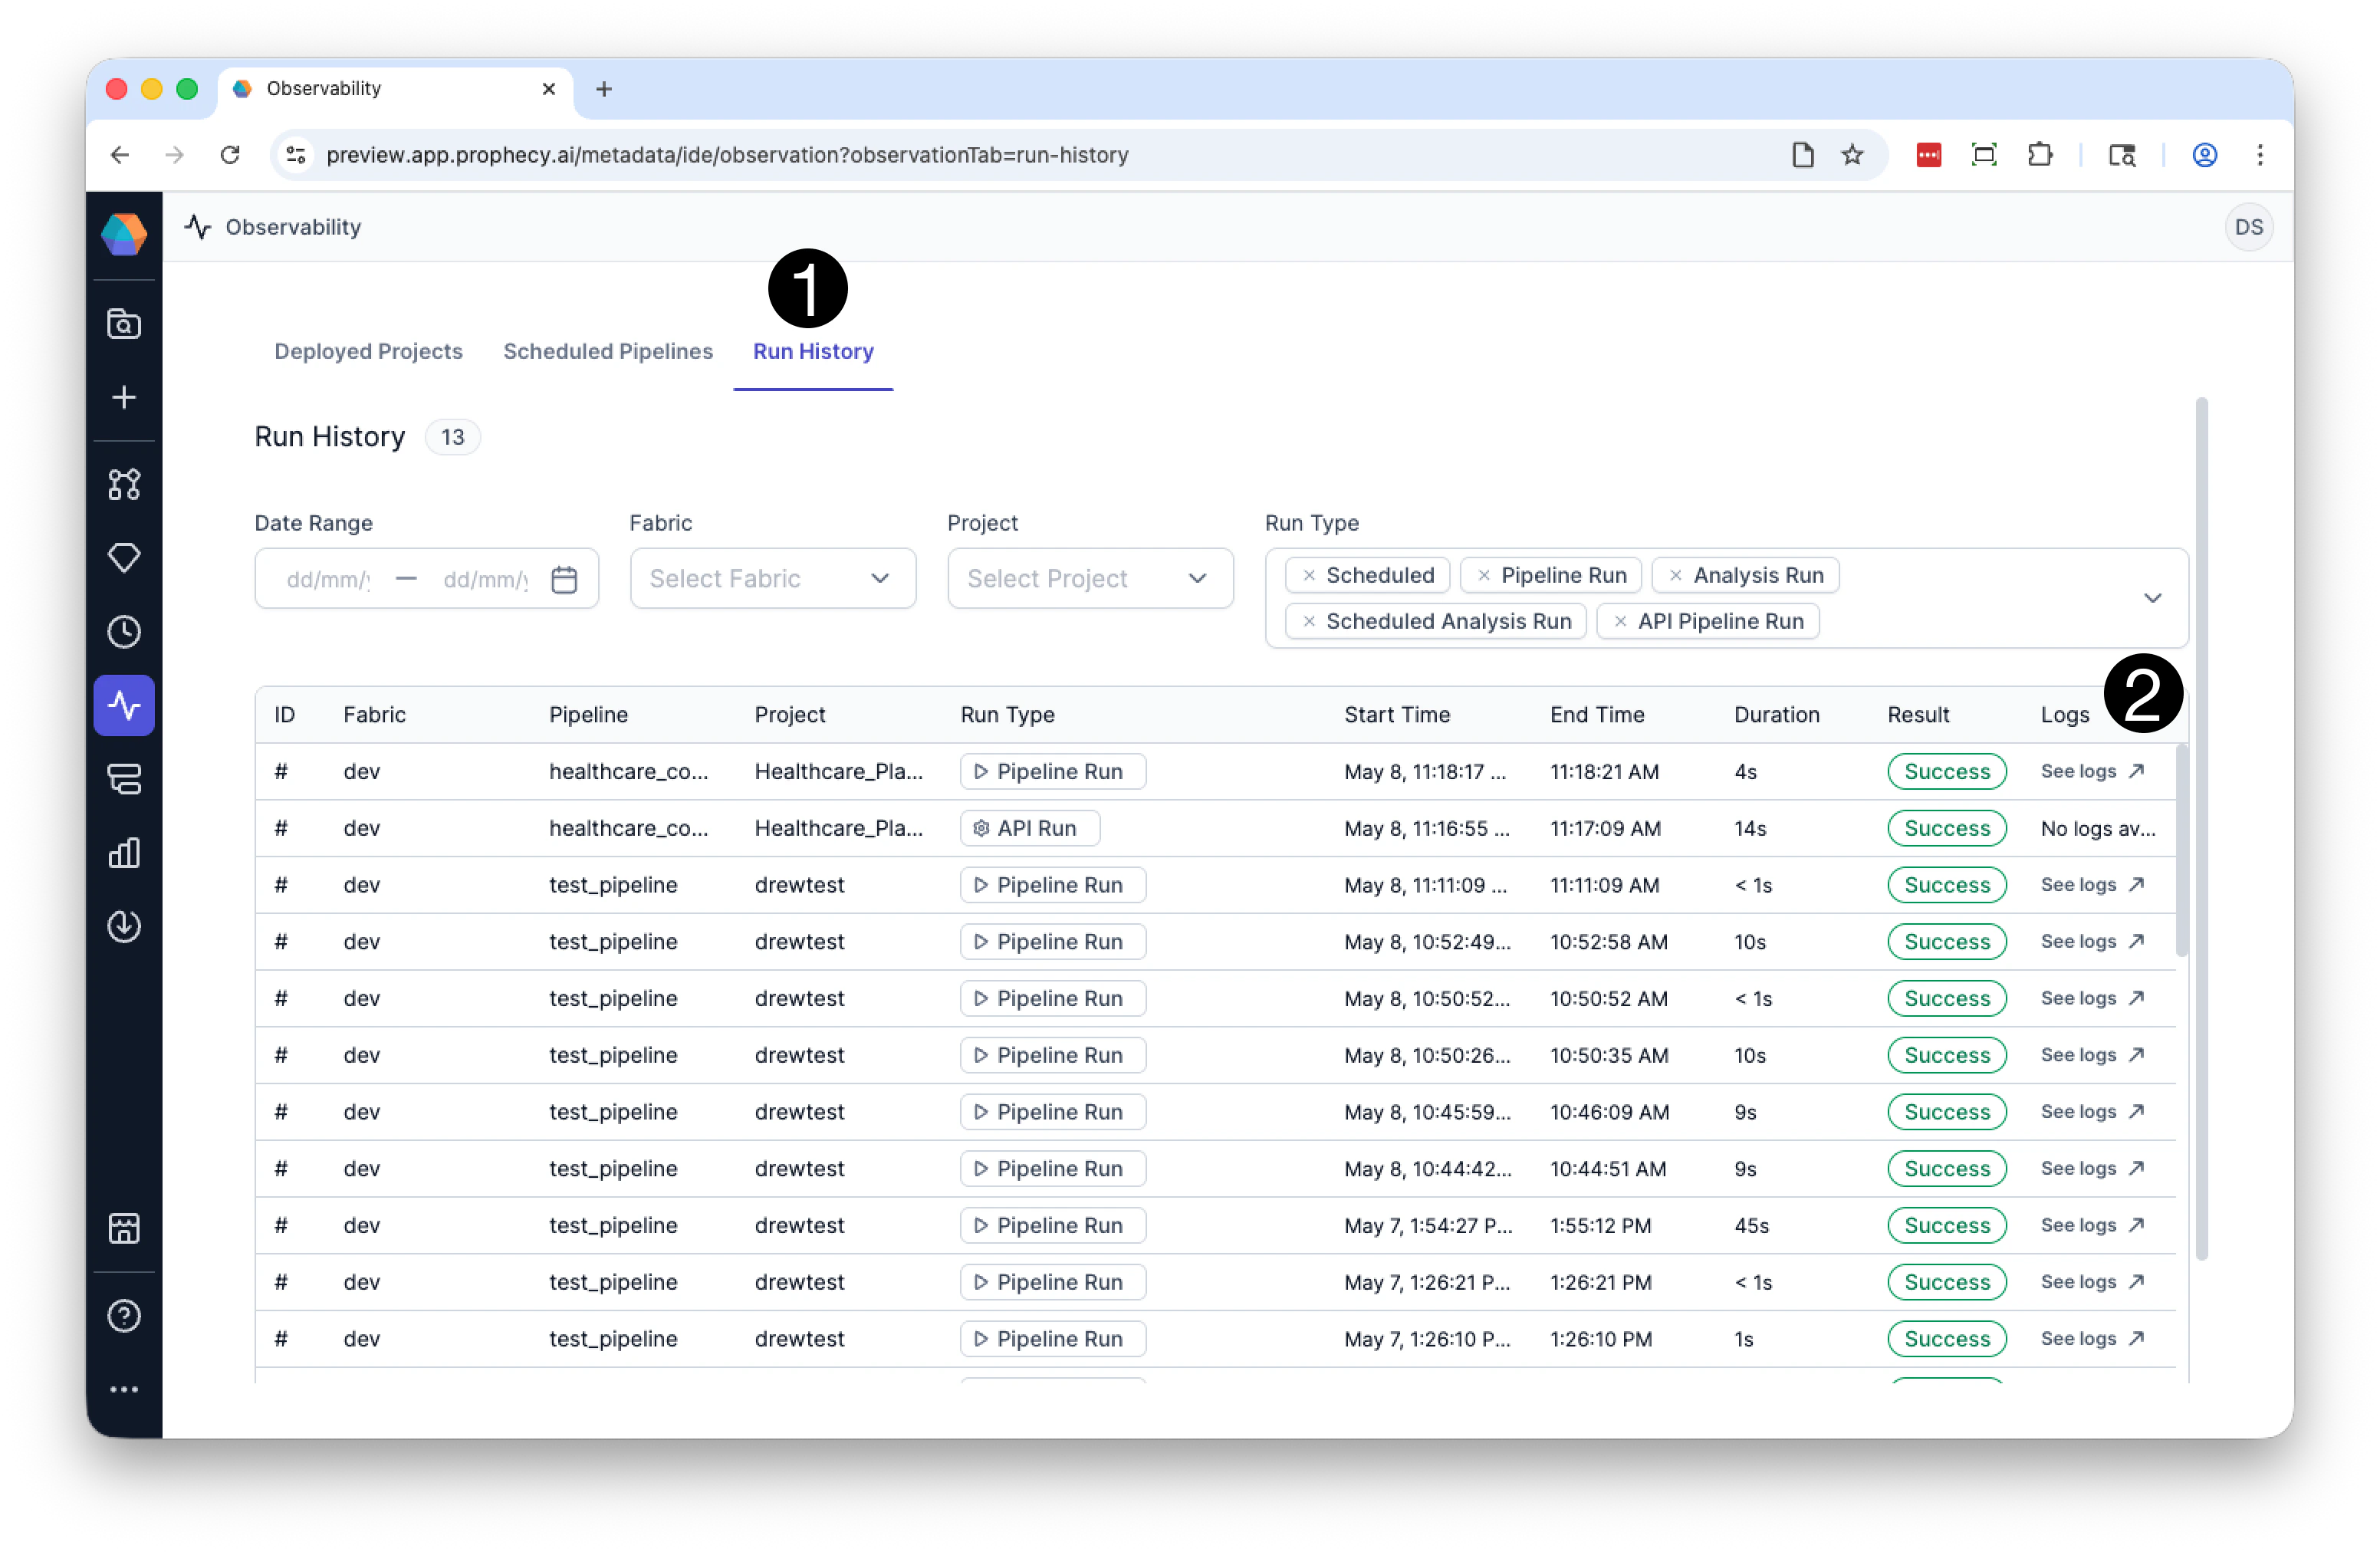
Use the **Run History** tab in the Observability interface to view and analyze recent pipeline runs across all fabrics and projects. This page provides detailed metadata for each run, including its type, duration, status, and execution context.
You can also use Run History to open **historical runtime logs** and inspect previous pipeline executions in Historical Mode.
Use the following filters to narrow the results.
| Field | Description |
| -------------- | ------------------------------------------------------------------------------------------------------------------------------------------------------------------------------------- |
| **Date Range** | Select a date range to limit results to runs that started in that window. |
| **Fabric** | Filter by fabric used to run the pipeline. |
| **Project** | Filter by the name of the project that contains the pipeline. |
| **Run Type** | Select one or more run types to include. Supported values include:- Scheduled
- Pipeline Run
- App Run
- Scheduled App Run
- API Pipeline Run
|
For each historical pipeline run, Prophecy provides the following information.
| Column | Description |
| -------------- | ---------------------------------------------------------------------------------------------------------------------------------------------------------------------------------------------------------------- |
| **ID** | Hover the **#** sign to view the full unique pipeline run ID.
You can reference this value in the [Trigger Pipeline API](/api-reference/pipelines/trigger-pipeline-run). |
| **Fabric** | Name of the fabric used to execute the pipeline run. |
| **Pipeline** | Name of the pipeline that was executed. |
| **Project** | Name of the project containing the pipeline. |
| **Run Type** | How the run was triggered.
This includes interactive runs, pipeline schedules, APIs, and analysis runs.
Any scheduled runs include additional information about the schedule that triggered the run. |
| **Start Time** | Timestamp when the run started. |
| **End Time** | Timestamp when the run completed. |
| **Duration** | Elapsed time of the run. |
| **Result** | Status of the run: `Success` (green) or `Failed` (red). |
| **See logs** | Opens historical runtime logs and the associated pipeline snapshot in Historical Mode. |
## Open historical runtime logs
You can inspect completed pipeline executions directly from the Run History table.
To open historical runtime logs:
1. Open the **Run History** tab and locate the run you want to inspect.
2. Click **See logs** in the far-right column.
 Prophecy opens the selected pipeline in **Historical Mode**, restoring:
* Runtime logs for the selected execution
* The historical pipeline snapshot
* Component execution statuses and progress information
In Historical Mode, the pipeline canvas becomes read-only so you can safely review the historical execution context without modifying the current pipeline version.
Historical runtime logs and pipeline snapshots are retained for a limited period of time and may
not be available for every historical run.
For more information about runtime logs, Historical Mode, and pipeline snapshots, see [Runtime logs](/data-analysis/development/runs/runtime-logs).
Prophecy opens the selected pipeline in **Historical Mode**, restoring:
* Runtime logs for the selected execution
* The historical pipeline snapshot
* Component execution statuses and progress information
In Historical Mode, the pipeline canvas becomes read-only so you can safely review the historical execution context without modifying the current pipeline version.
Historical runtime logs and pipeline snapshots are retained for a limited period of time and may
not be available for every historical run.
For more information about runtime logs, Historical Mode, and pipeline snapshots, see [Runtime logs](/data-analysis/development/runs/runtime-logs).