> ## Documentation Index
> Fetch the complete documentation index at: https://docs.prophecy.ai/llms.txt
> Use this file to discover all available pages before exploring further.
# Data profiling for Data Engineers
> See high level statistics for data samples in your pipeline
Data profiling allows you to view statistics on interim datasets in your pipeline. When you open a dataset's profile in the [Data Explorer](/data-engineering/development/data-explorer/data-explorer), you can visualize value distributions and data completeness to ensure your data matches expectations.
## Prerequisites
To view data profiles, you need to:
* Work on a PySpark project.
* Upgrade the ProphecyLibsPython dependency 1.9.40 or later.
* Use [selective data sampling mode](/data-engineering/development/runs/data-sampling#selective-sampling) in the pipeline.
## Quick profile
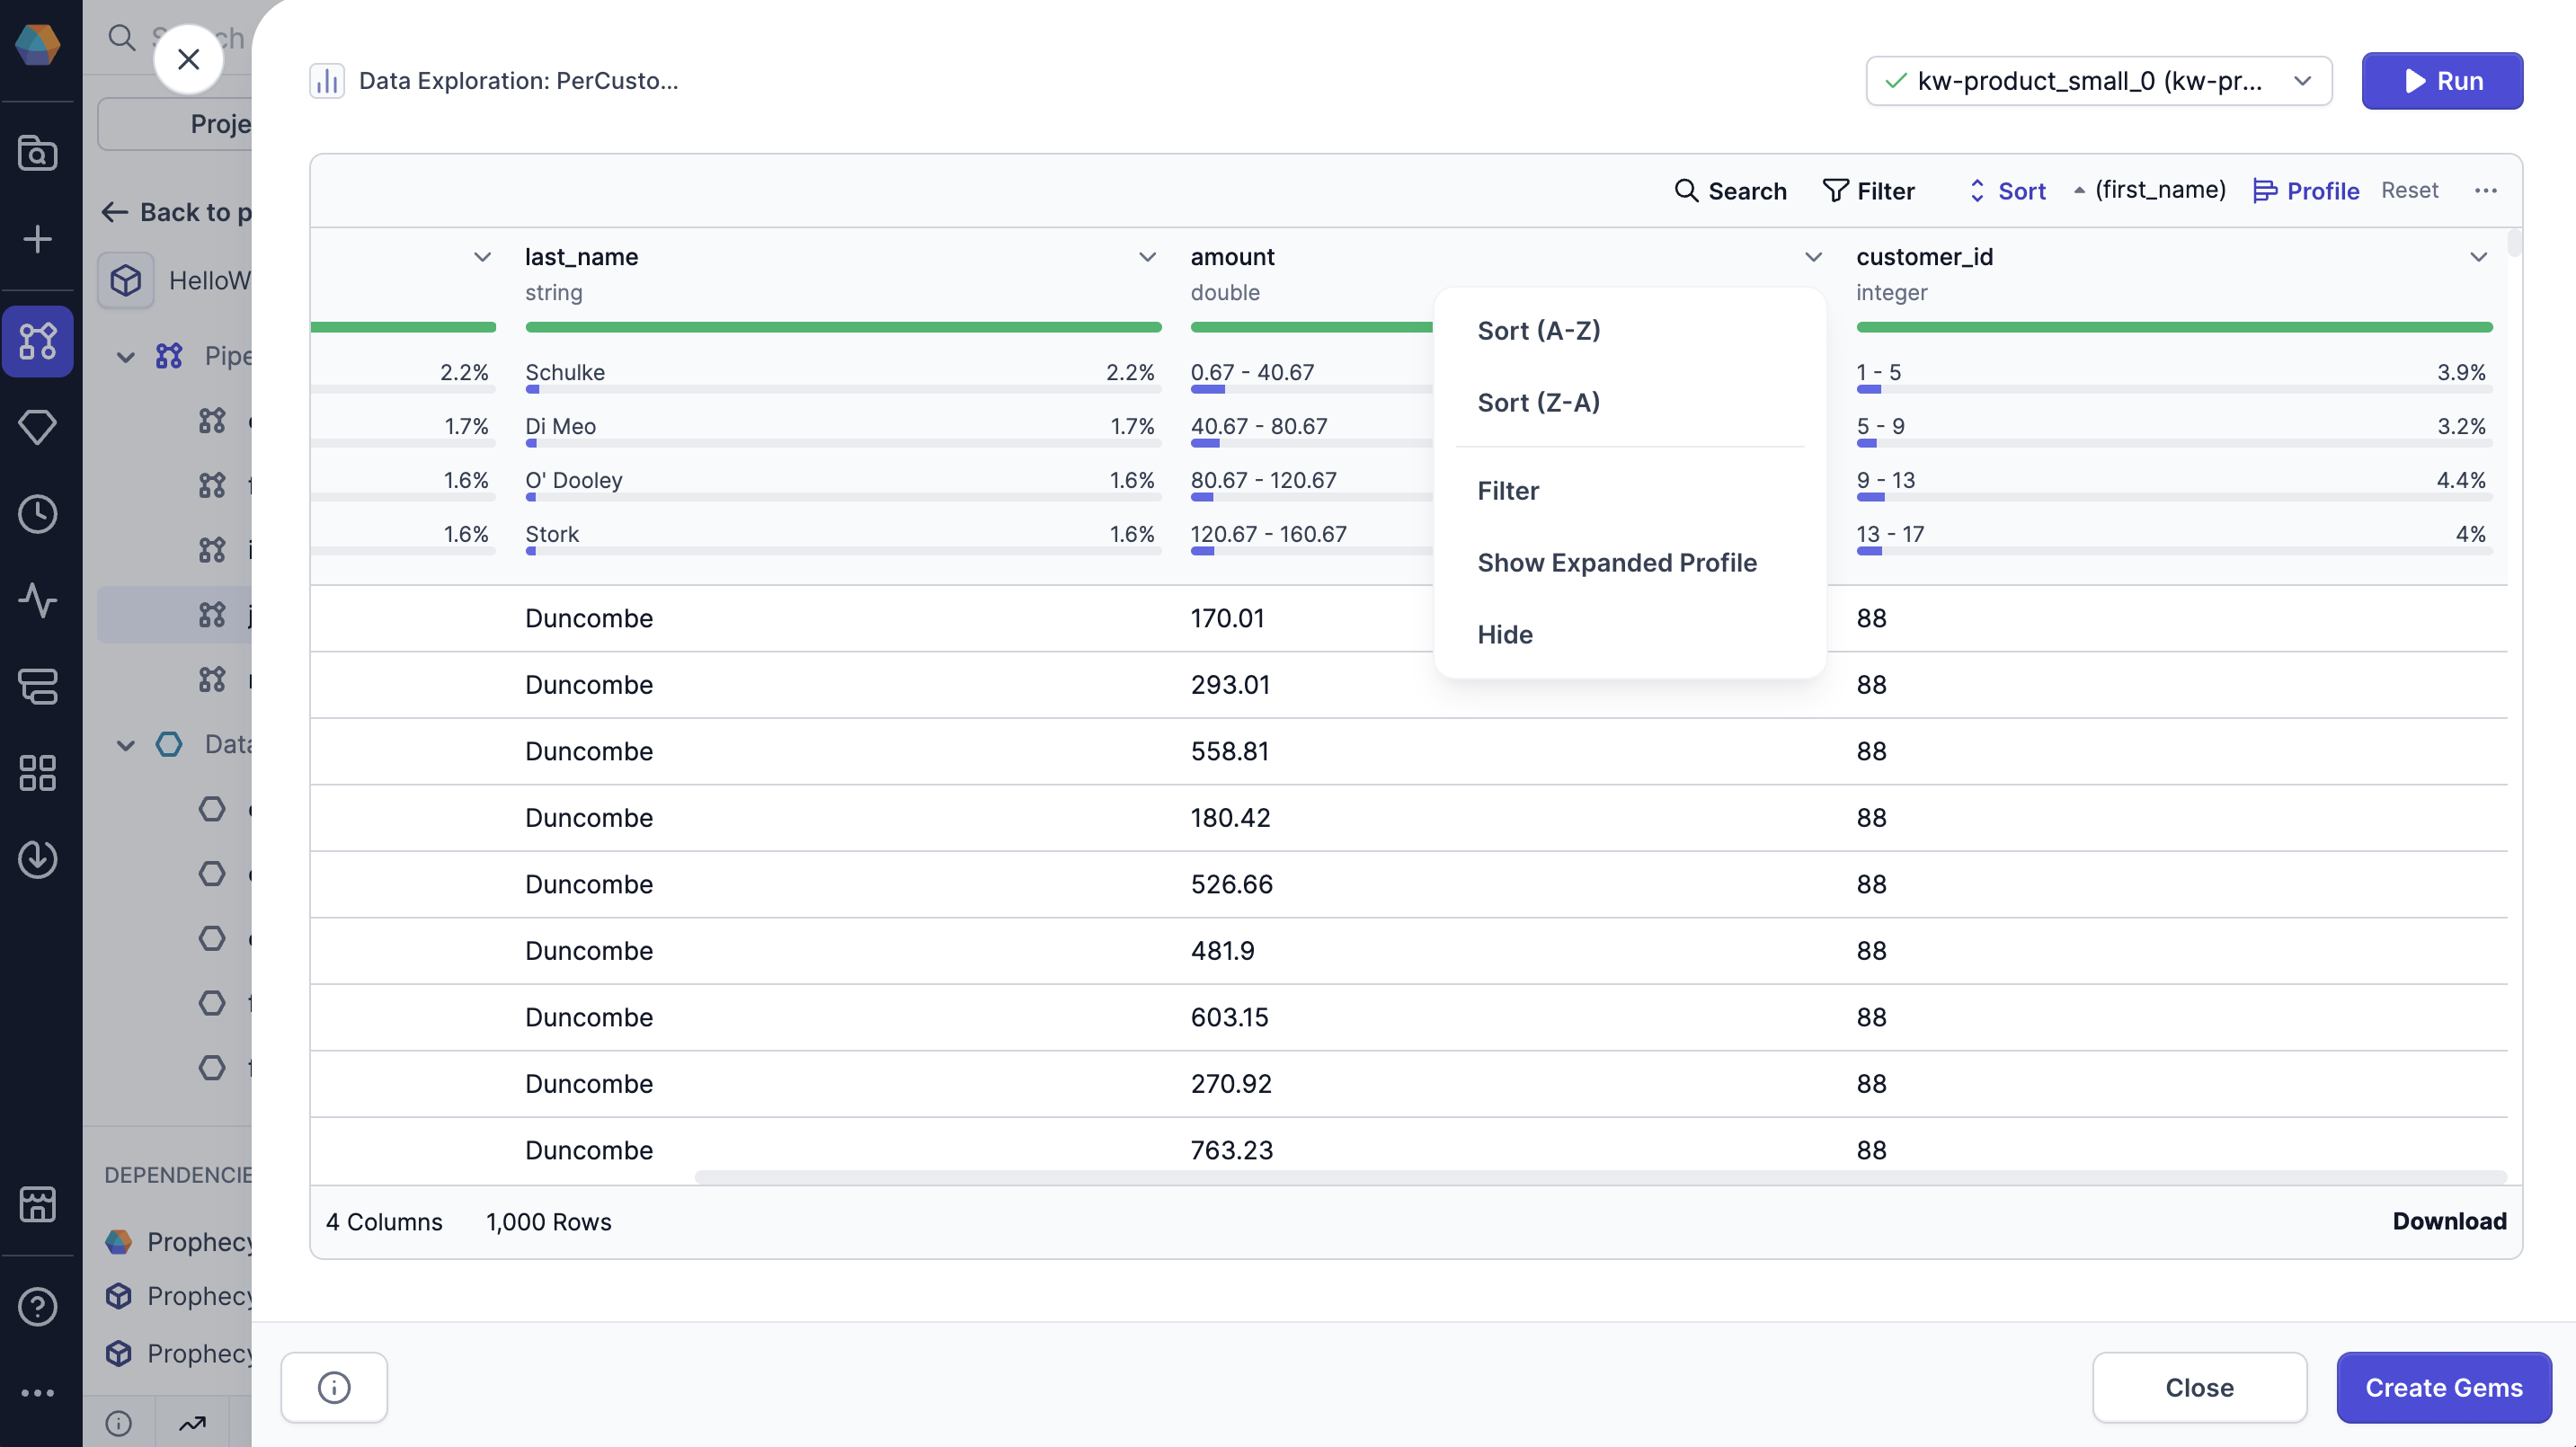
The Data Explorer includes data profiles that are generated on your sample data. You'll be able to see high-level statistics for each column, including:
* **Percent of non-blank values:** The percentage of values in the column that are not blank.
* **Percent of null values:** The percentage of values in the column that are null.
* **Percent of blank values:** The percentage of values in the column that are blank.
* **Most common values:** Displays the top four most frequent values in the column, along with the percentage of occurrences for each.
To view these statistics for your sample data, click **Profile** in the Data Explorer.
 ## Expanded profile
When you open the Data Explorer, you'll only see the data profile of the data **sample**. When you load the expanded data profile, Prophecy generates a more in-depth analysis on **all of the records** in the interim dataset.
## Expanded profile
When you open the Data Explorer, you'll only see the data profile of the data **sample**. When you load the expanded data profile, Prophecy generates a more in-depth analysis on **all of the records** in the interim dataset.
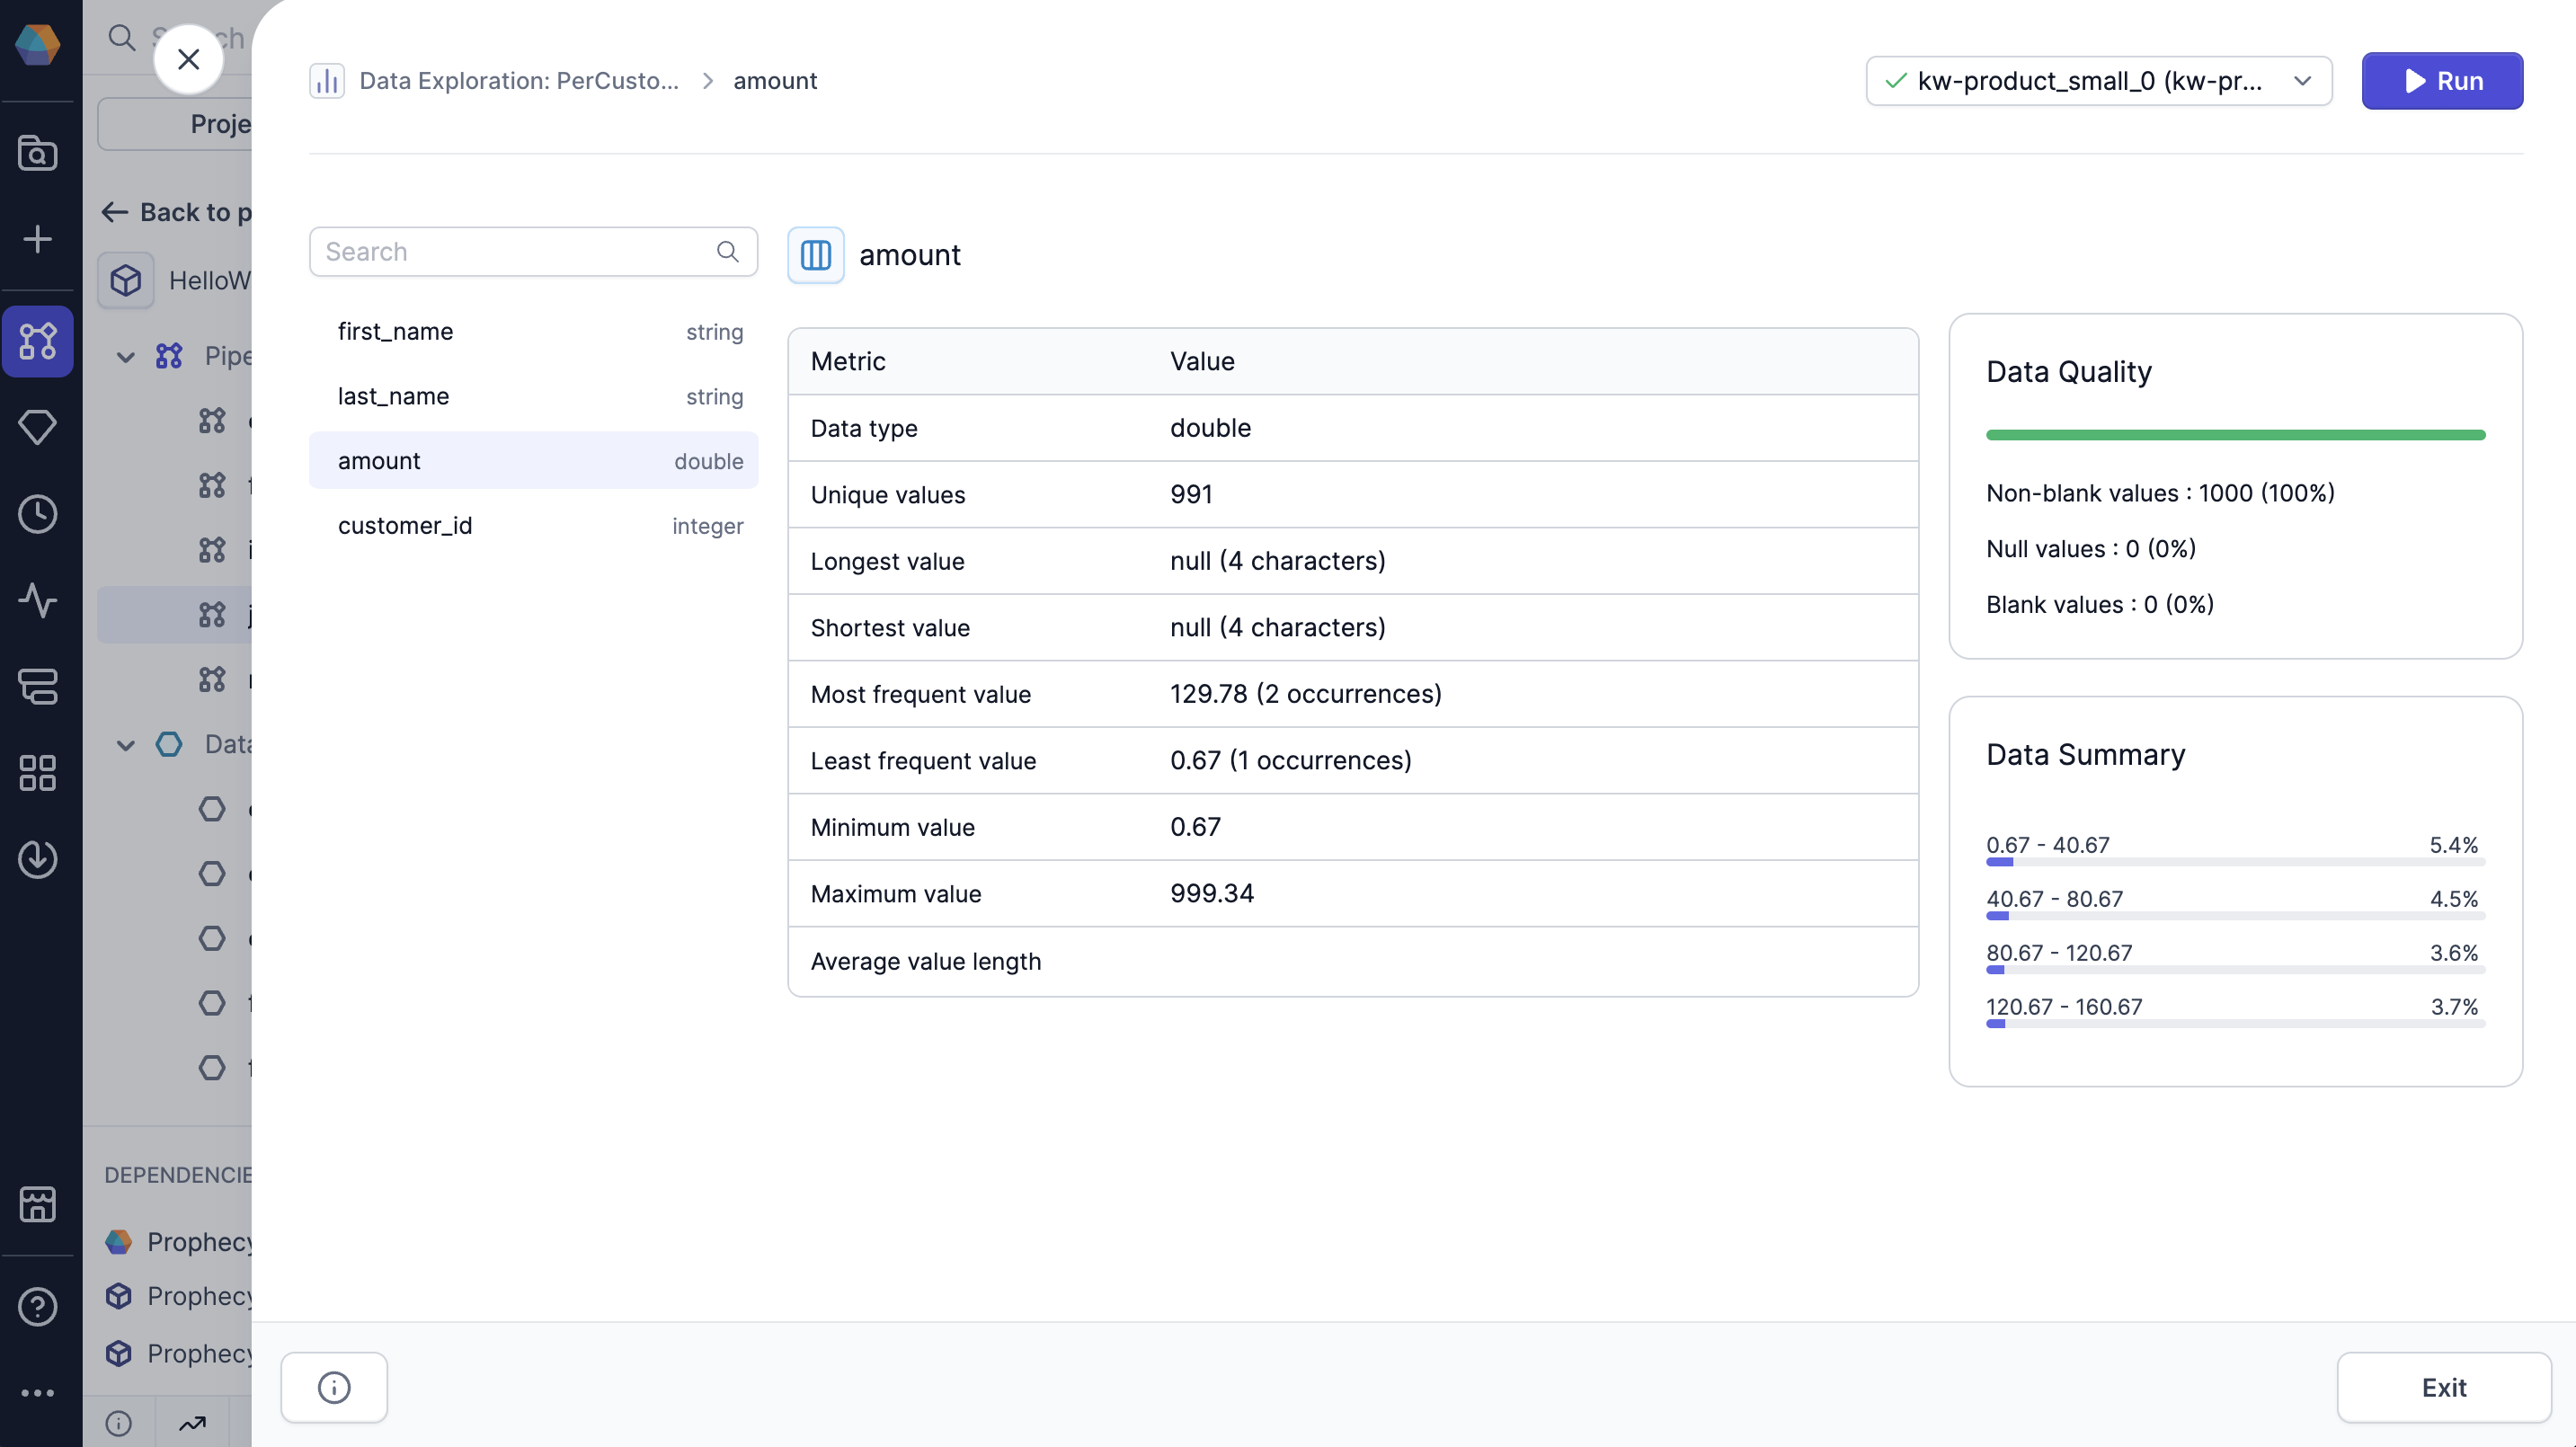 The full profile displays the following information:
* **Data type**: The data type of the column.
* **Unique values**: The number of unique values in the column.
* **Longest value**: The longest value in the column and its length.
* **Shortest value**: The shortest value in the column and its length.
* **Most frequent value**: The most frequent value in the column and its number of occurrences.
* **Least frequent value**: The least frequent value in the column and its number of occurrences.
* **Minimum value**: The minimum value in the column.
* **Maximum value**: The maximum value in the column.
* **Average value length**: The average length of each value in the column.
* **Null values**: The percent and number of null values in the column.
* **Blank values**: The percent and number of blank values in the column.
* **Non-blank values**: The percent and number of non-blank values in the column.
* **Data summary**: An overview of the most common values in the column.
You can click between columns in the expanded profile for quick access.
### Open expanded profile
To view the expanded profile:
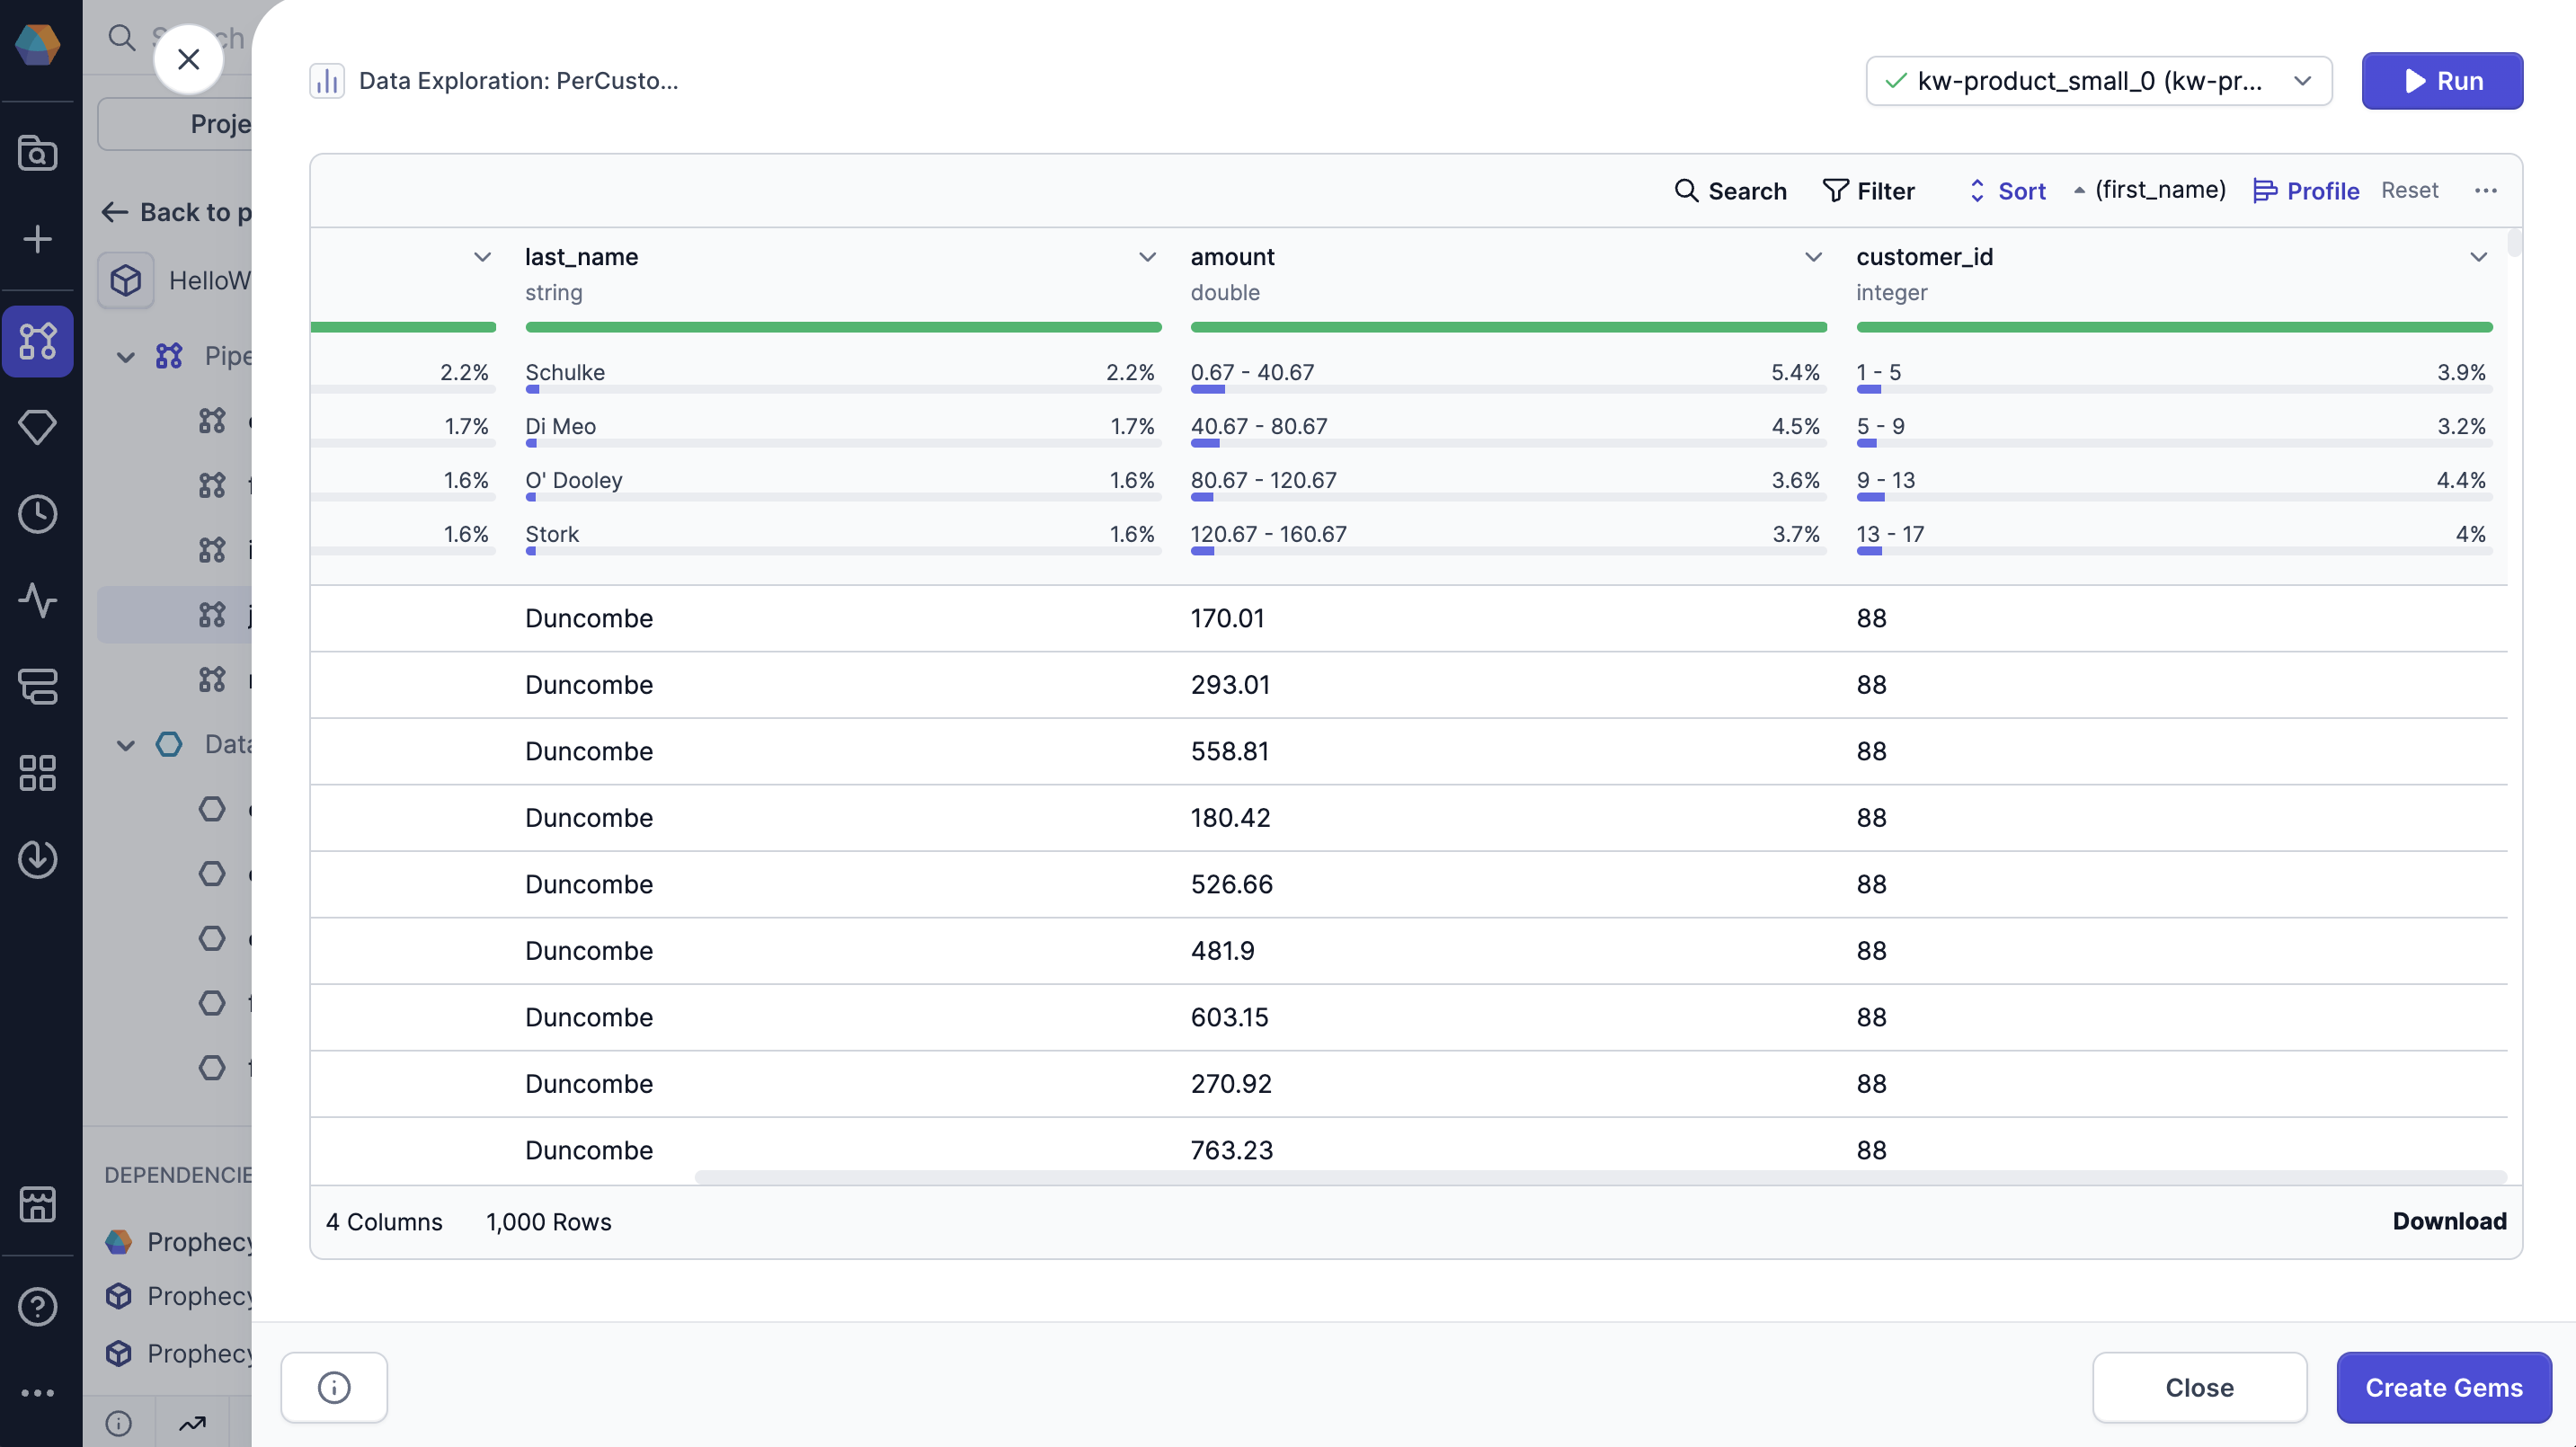
1. Click the dropdown arrow on the column you want to expand.
2. Select **Show Expanded Profile**.
The full profile displays the following information:
* **Data type**: The data type of the column.
* **Unique values**: The number of unique values in the column.
* **Longest value**: The longest value in the column and its length.
* **Shortest value**: The shortest value in the column and its length.
* **Most frequent value**: The most frequent value in the column and its number of occurrences.
* **Least frequent value**: The least frequent value in the column and its number of occurrences.
* **Minimum value**: The minimum value in the column.
* **Maximum value**: The maximum value in the column.
* **Average value length**: The average length of each value in the column.
* **Null values**: The percent and number of null values in the column.
* **Blank values**: The percent and number of blank values in the column.
* **Non-blank values**: The percent and number of non-blank values in the column.
* **Data summary**: An overview of the most common values in the column.
You can click between columns in the expanded profile for quick access.
### Open expanded profile
To view the expanded profile:
1. Click the dropdown arrow on the column you want to expand.
2. Select **Show Expanded Profile**.