

Available for Enterprise Edition only.
Execution metrics are available for Spark pipelines only.
Access control
Execution metrics are controlled at the team level. This means:- Team admins can enable or disable execution metrics for their team
- Metrics are only captured for pipelines running on fabrics assigned to teams with execution metrics enabled
- All team members can view execution metrics for pipelines they have access to
Storage architecture
Execution metrics storage varies by execution environment, with different capabilities for automatic table creation and storage options.What execution metrics are stored?
There are three execution metrics tables that store data for pipelines, individual components, and the generated data samples, also known as interims.- Pipeline runs table: The pipeline metrics table that contains metrics and code for pipeline runs
- Component runs table: The component (dataset) metrics table that contains metrics for individual component runs
- Interims table: The interims table that contains samples of data, depending on the interim mode selected
Databricks
By default, Prophecy automatically creates and stores execution metrics in Delta tables within your Databricks workspace. These are created in the workspace’s default storage and uses configured metastore (Unity Catalog, Hive metastore, etc.). If preferred, you can specify custom database and table names where you want to store the data.Reading execution metrics from High-Concurrency Clusters with Table-ACL enabled is supported in Databricks runtimes 11.0 or below. Execution metrics are not available for
Shared mode clusters (both normal workspaces and Unity Catalog workspaces). You should see an error when trying to get historical runs of pipelines/jobs executed on Shared mode clusters.Additionally, for clusters with table ACL enabled, you may have limited access on catalogs, schemas, and tables. For this case, we recommend you set up your execution metrics tables manually and point to them in Prophecy.Store as Delta tables
The following are sampleCREATE TABLE commands for tables using Delta.
These are suitable for Databricks or if your metastore supports Delta tables.
Create pipeline metrics table
Create pipeline metrics table
Create component metrics table
Create component metrics table
Create interims table
Create interims table
Grant permissions on these tables
Grant permissions on these tables
Amazon EMR
Prophecy cannot automatically create tables in AWS. You must create the required tables before enabling execution metrics.- Hive Metastore: Default storage location for execution metrics.
- AWS Glue: Tables can be stored in Glue Data Catalog with S3 as the underlying storage. When using Glue databases with S3 storage, EMR or EMR Serverless instances must be in the same AWS region as your Glue tables.
Store tables as Parquet
The following are sampleCREATE TABLE commands for tables using Parquet.
These are suitable for Livy or for your Hive metastore in Hadoop setups.
Create pipeline metrics table
Create pipeline metrics table
Create components metrics table
Create components metrics table
Create interims table
Create interims table
View execution metrics
You can find execution metrics in the historical runs of pipelines and datasets.Pipeline execution metrics
- From the Metadata page in Prophecy, open your project.
- Click on Content.
- Open a pipeline that you want to inspect.
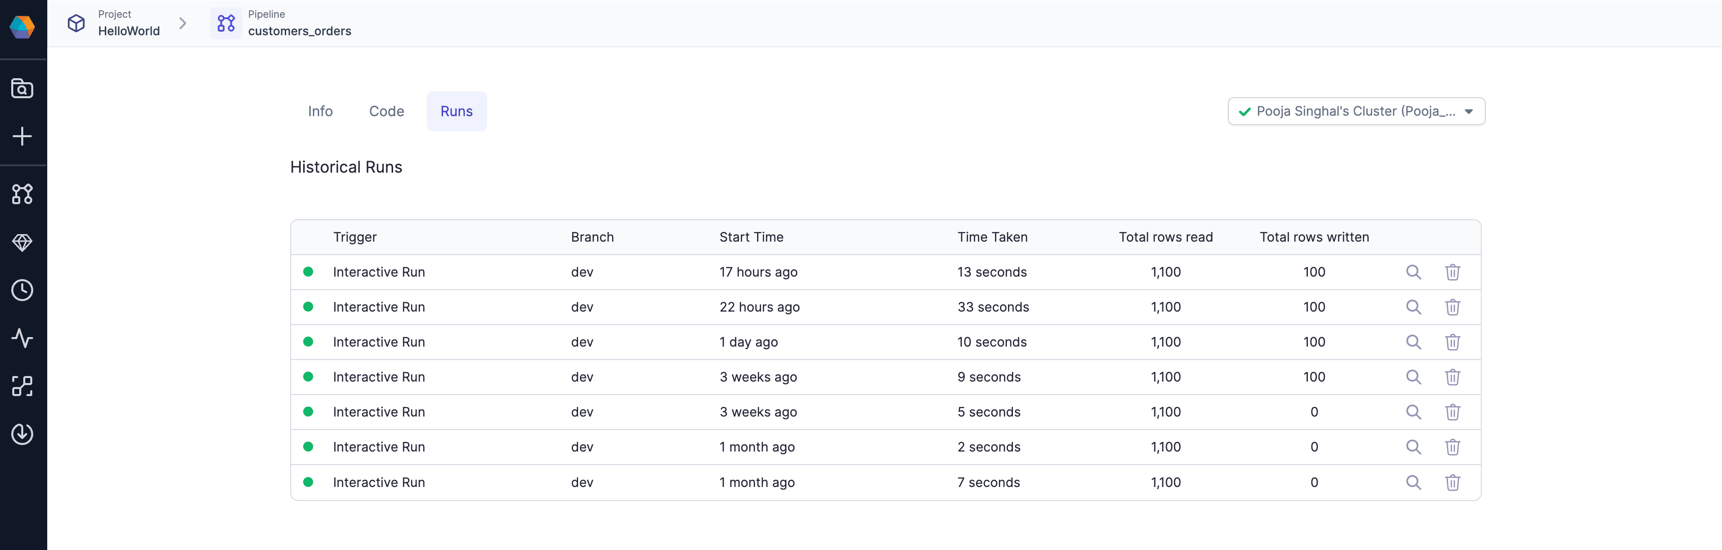
- Navigate to the Runs tab. Each row corresponds to one run of the pipeline.
- Click on a particular run and see the interims for that run, as well as metrics like rows read, rows written, time taken, etc.
Dataset execution metrics
- From the Metadata page in Prophecy, open your project.
- Click on Content.
- Open a dataset that you want to inspect.
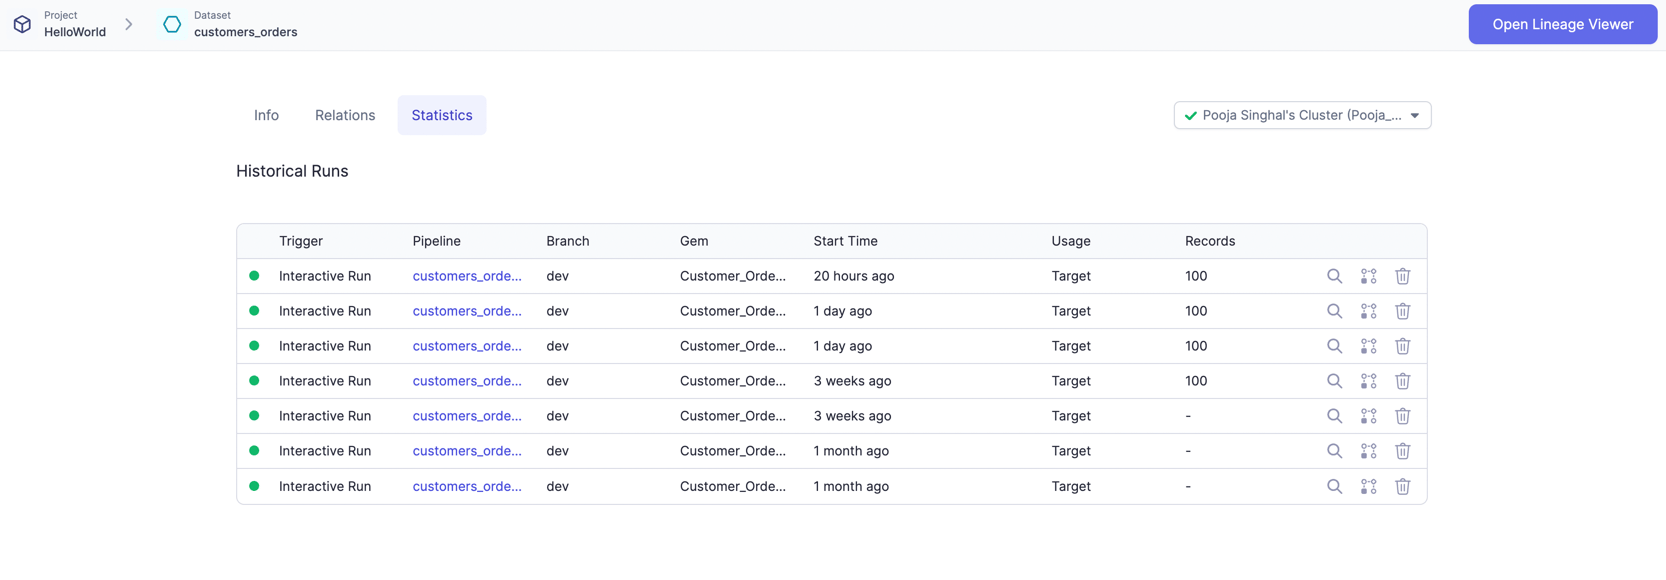
- Navigate to the Statistics tab. Each row corresponds to one pipeline run where this dataset was used.
- Click on a particular run and see more detailed insights on your data, along with a preview.
Enable execution metrics
Prerequisites
Before enabling execution metrics for a team, ensure the following requirements are met:- Team access: You must be a team admin for the team where execution metrics will be enabled.
- Execution environment: Execution metrics are only available for pipelines running on Spark.
- For EMR environments: Prophecy cannot automatically create tables in AWS. You must create the required tables in advance to store execution metrics.
Procedure
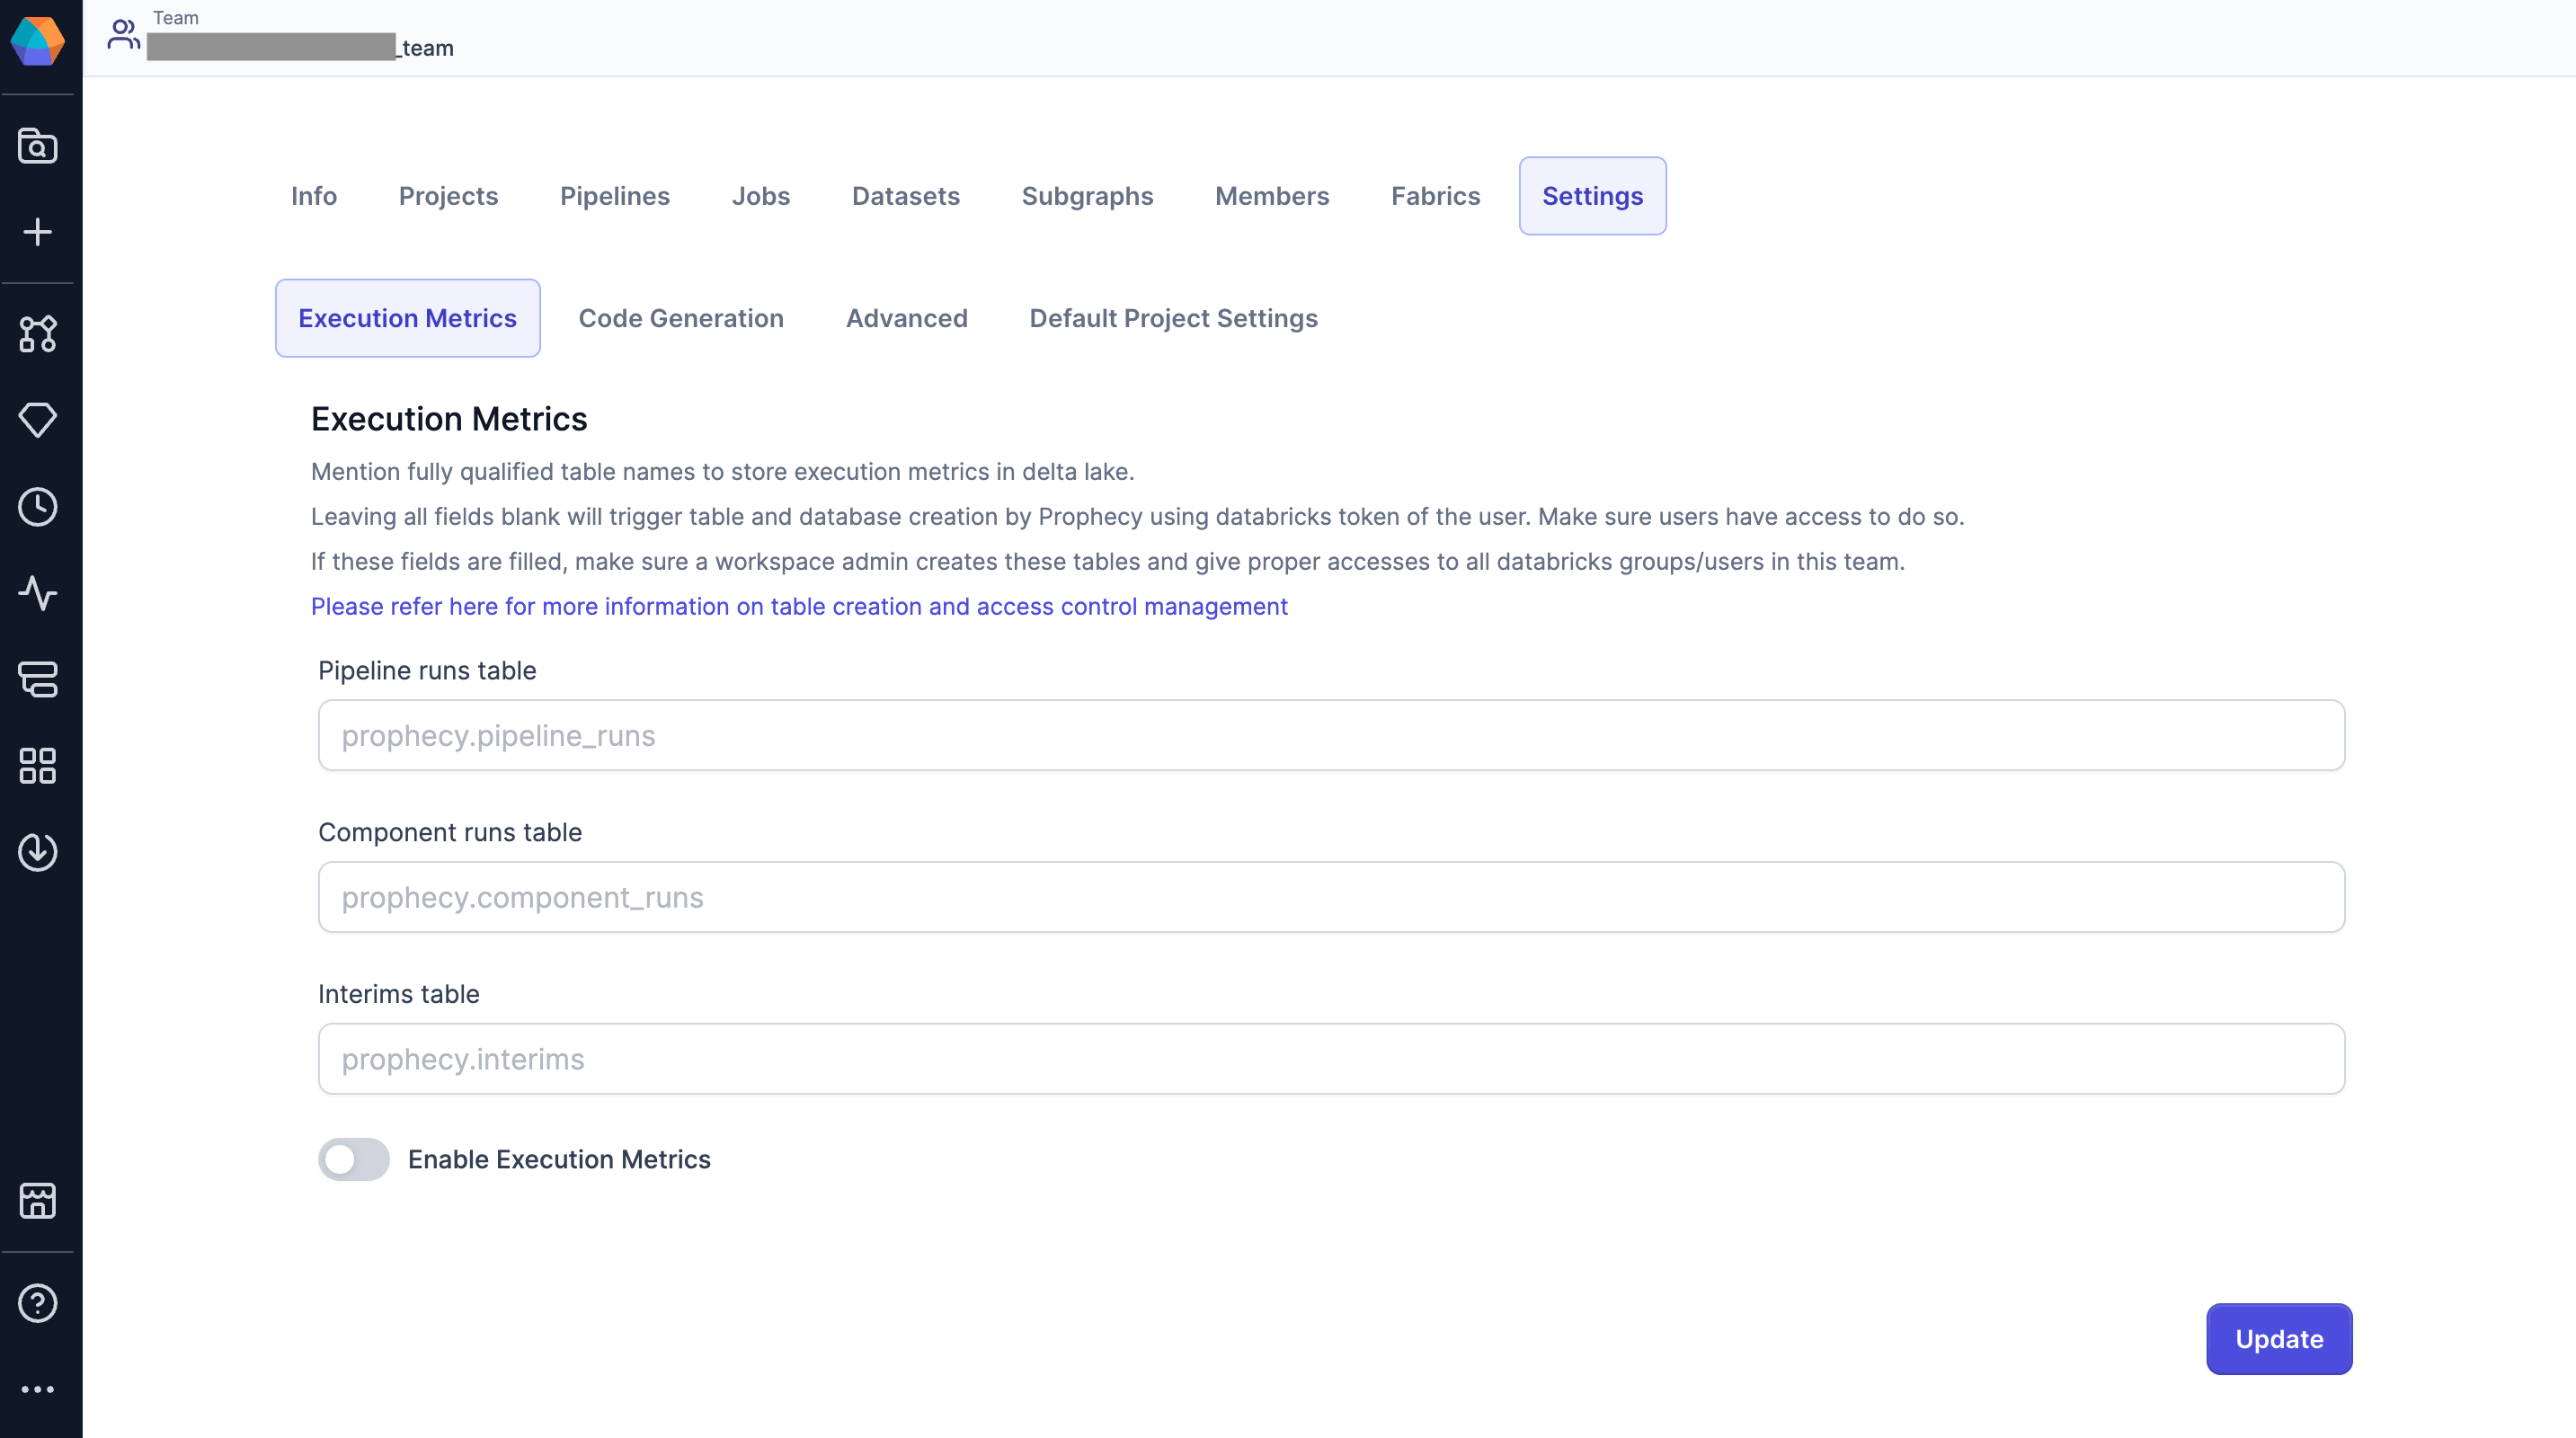
Use the following steps to configure execution metrics for a team.- Open the Metadata page of the Prophecy UI.
- Navigate to the Teams tab.
- Open the team for which you would like to enable execution metrics.
- Navigate to the Settings > Execution Metrics subtab.
- Turn on the Enable Execution Metrics toggle.
- If applicable, add your table to the Pipeline runs table:
<database>.<pipeline-table> - If applicable, add your table to the Component runs table:
<database>.<component-table> - If applicable, add your table to the Interims table:
<database>.<interim-table> - Click Update to save your changes.