Build conditional logic, filters, and reusable expressions with the visual expression builder
Use the visual expression builder to create conditional logic, combine multiple filter conditions, build reusable expressions with parameters, and define complex business rules without writing SQL manually.Common use cases include:
categorizing records based on conditions
building multi-condition filters with AND and OR
creating derived columns
handling null values
using parameters in expressions
creating reusable business logic across pipelines
This page explains common expression patterns you can create with the visual expression builder.
The following table describes options for the visual expression builder.
Feature
Description
Comparison
Lets you establish relationships between two simple expressions connected by an operator. This mode helps you perform comparisons or existence checks on your data that always evaluate to true or false.
Grouping
Combine multiple comparison expressions into groups using logical operators like AND and OR. This structure enables you to express intricate business logic in a visual format.
Parameters
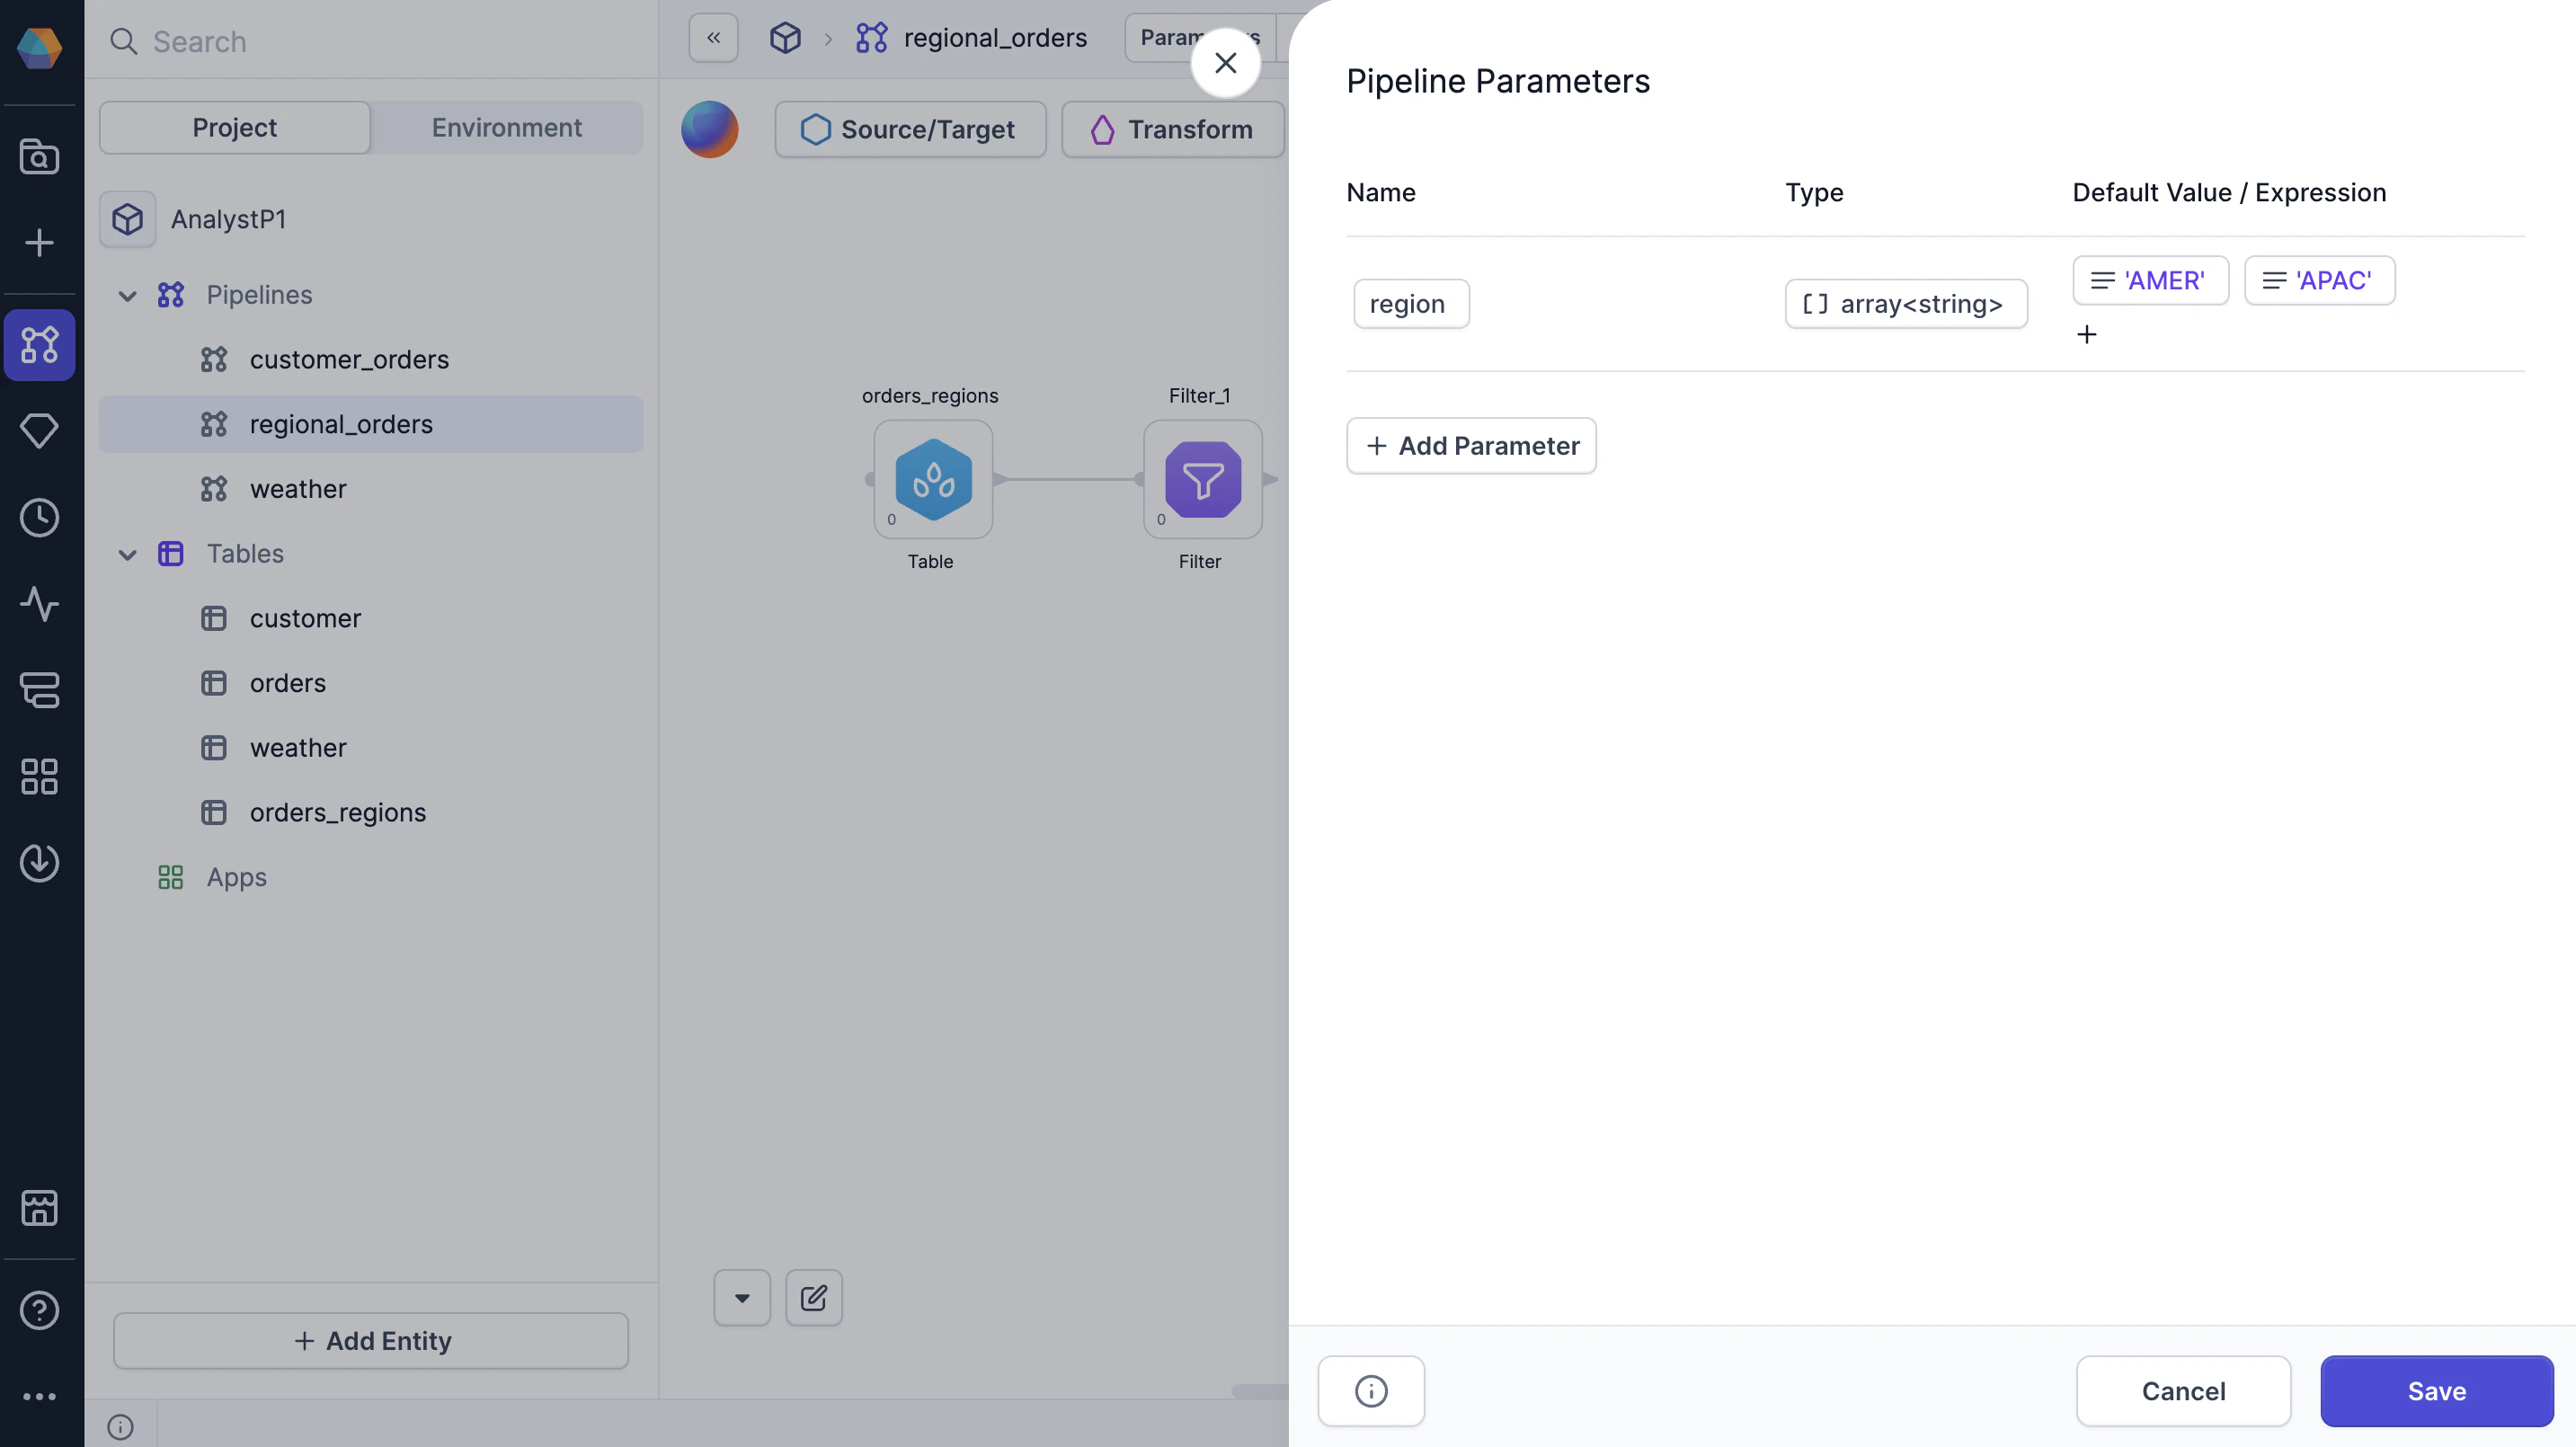
Enables you to include variables in your expressions that may vary at runtime. Parameters only show up in the Configuration Variables of the visual expression builder after you have created them at the pipeline level.
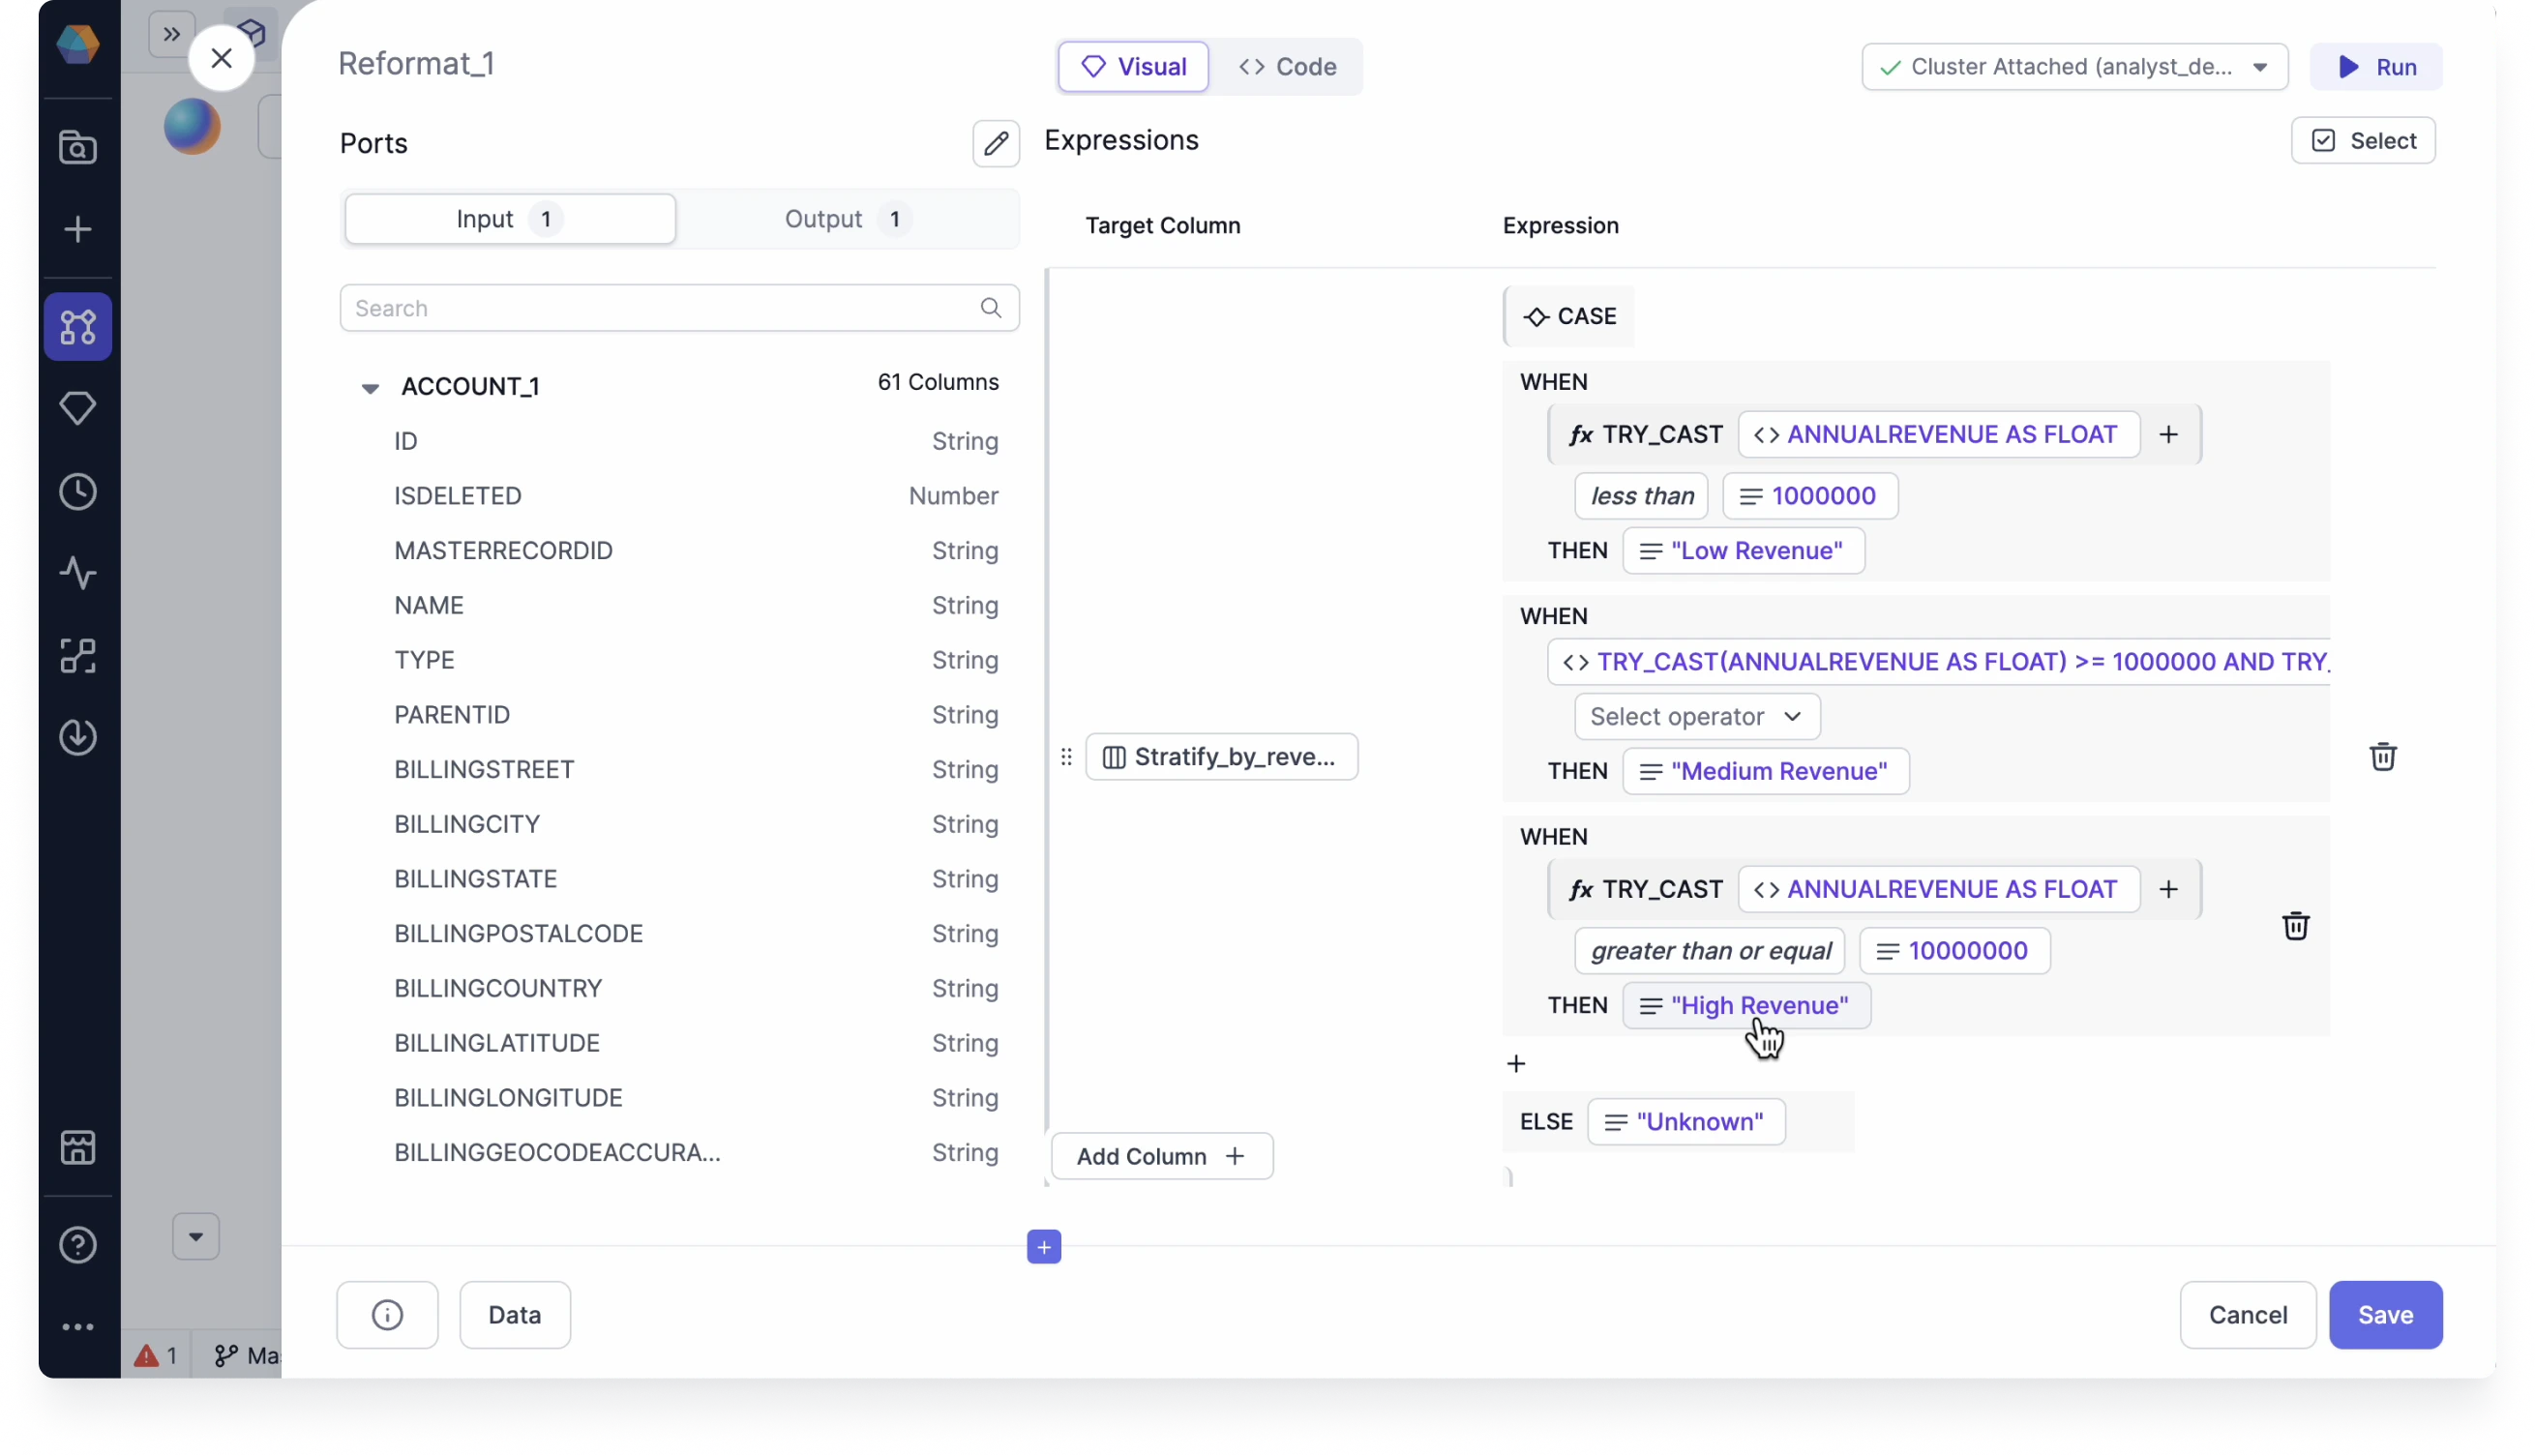
Let’s say you want to stratify accounts based on their annual revenues. Each condition we set up is limited to one comparison. This example combines conditional logic with comparison operators.
For THEN, click Select expression and select Value. Enter Low Revenue as the value.
Click + on the next line and select Add CASE to add another WHEN clause.
Repeat steps 3 to 8 to set up the rest of the comparison expressions.
Click + on the next line and select Add ELSE to add an ELSE statement.
Click Select expression and select Value. Enter Unknown as the value.
This conditional expression will categorize your accounts based on revenue thresholds, making it easier to perform segment-specific analysis and reporting. When the pipeline runs, each account will be assigned to the appropriate revenue category based on the conditions you’ve defined.
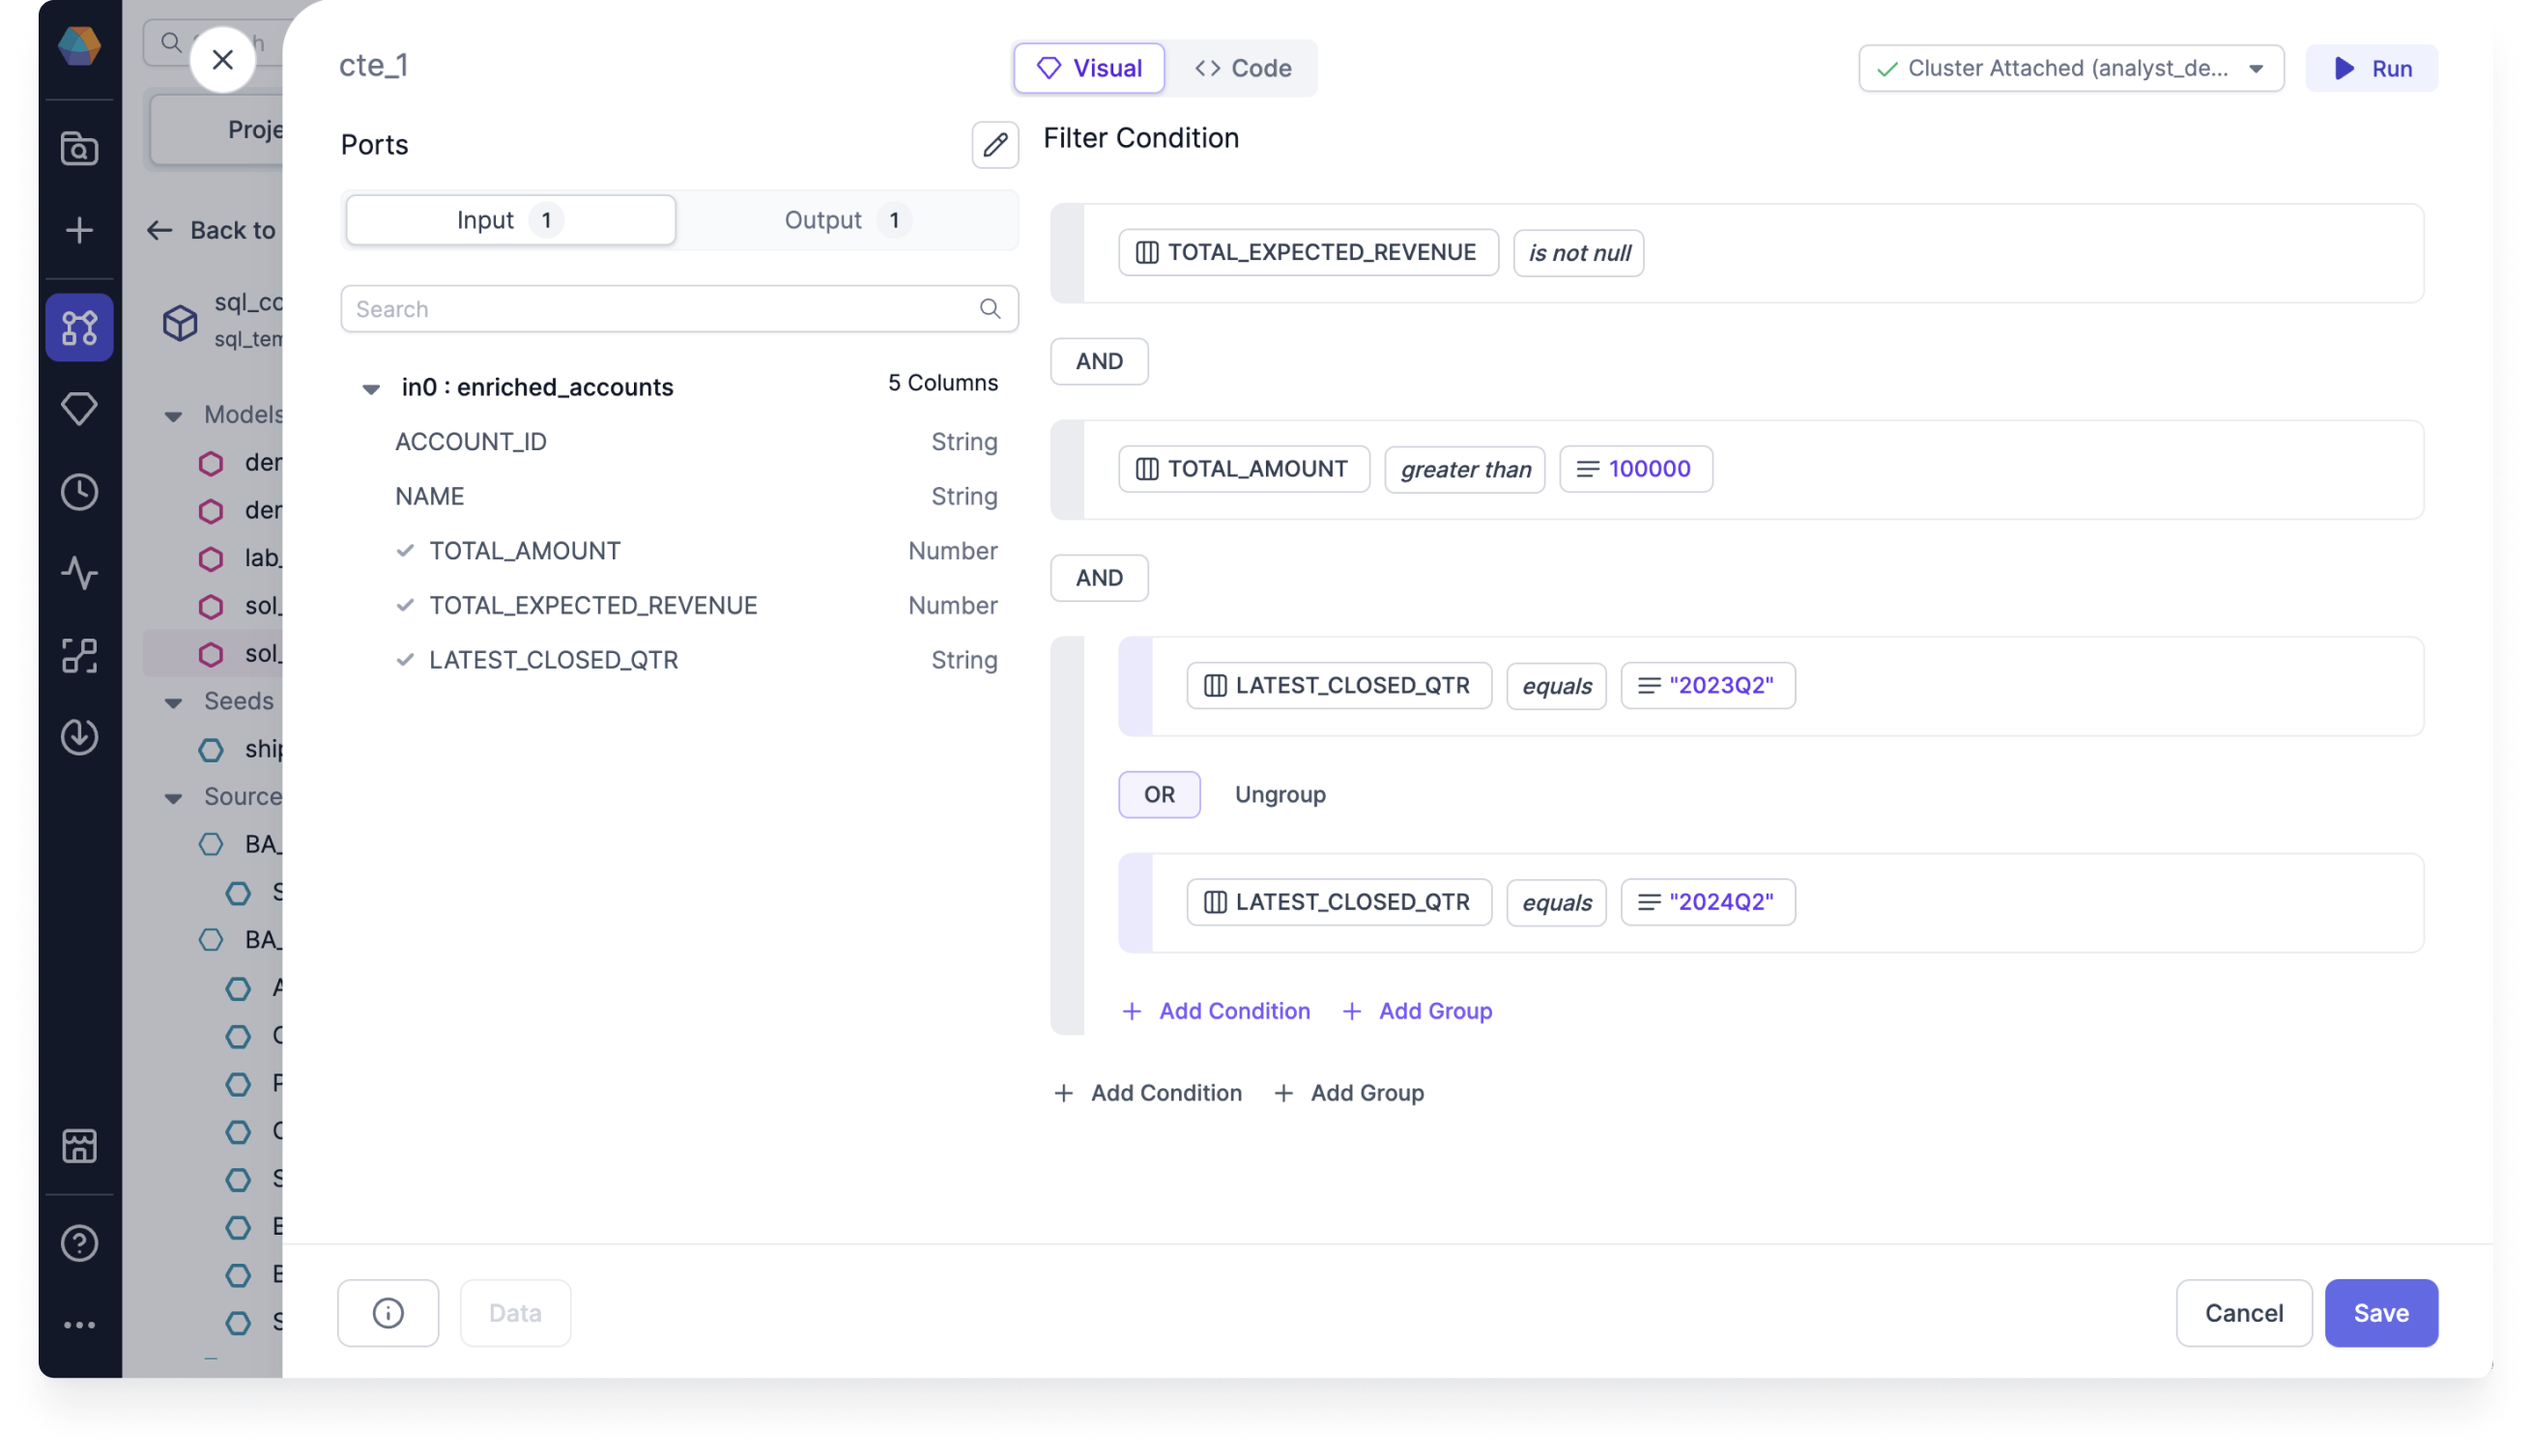
When filtering data, you often want the output data to meet multiple criteria. You can use Grouping for this by creating multiple AND and OR statements.Assume you have a dataset where you want to filter for the following:
Total expected revenue that is not null
Total amounts that are greater than 100000
Latest closed quarters that equals 2023Q2 or 2024Q2
You can have any number of groups and nestings (a group within a group). You can also always
change the grouping conditions between AND and OR.
Click Add Group. A grouped expression row appears.
Click Select expression > Column.
Select LATEST_CLOSED_QTR from the list.
Click Select operator and select equals.
Click Select expression > Value.
Enter 2023Q3 as the value.
Click + Add Condition and repeat steps 2 to 6 to set up the other OR condition.
This complex filter will return only high-value opportunities from specific quarters that have valid expected revenue values. By combining AND and OR conditions in this way, you can create precise data subsets that match your exact business requirements.
When you use a pipeline parameter in a visual expression, you can manipulate the value of that parameter using different configs at runtime. Let’s review an example that leverages an array parameter in a Filter gem.Imagine that you want to filter an Orders dataset based on the region where the order was placed. Specifically, you only want to keep rows where the region is included in the array parameter.
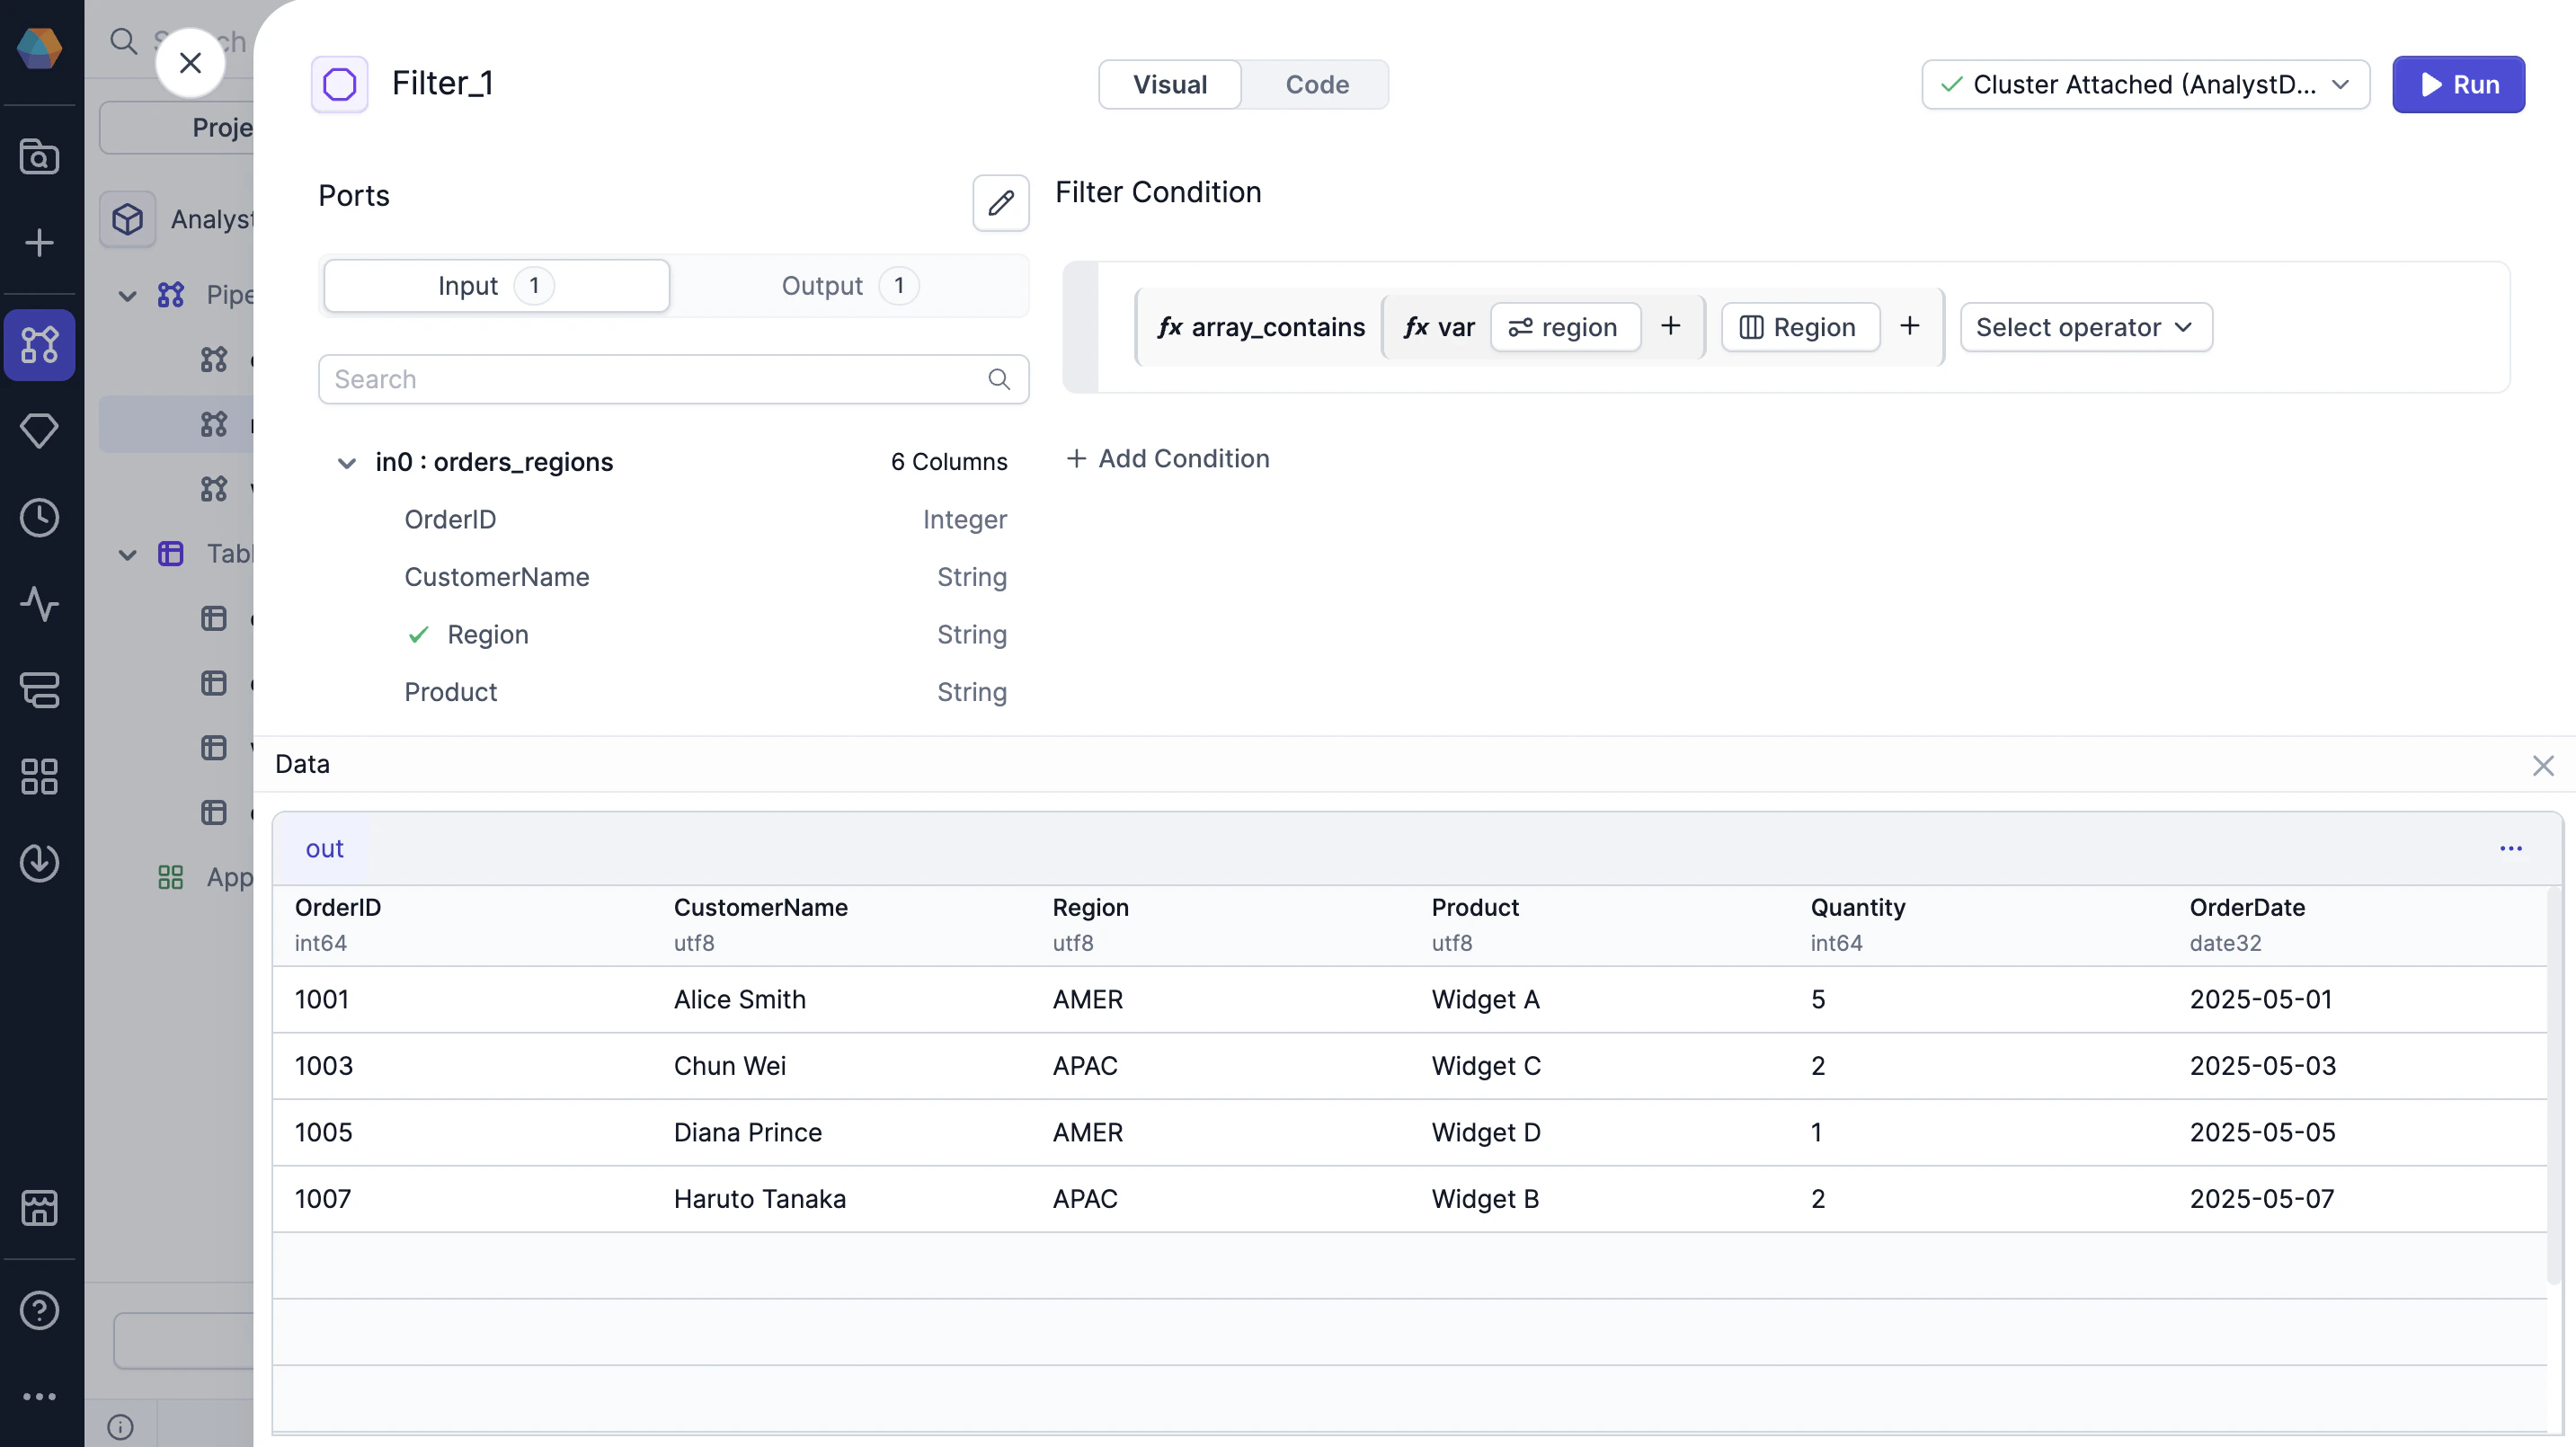
Now, you’ll use the parameter in an expression inside a Filter gem.
Create and open the Filter gem.
Remove the default true expression.
Click Select expression > Function and select array_contains.
In the array dropdown of the function, click Configuration Variable and select the region parameter.
In the value dropdown of the function, click Column and select the order region column.
The output of this gem will only include rows where the order region matches at least one value in the region array. When you run the pipeline interactively, it will use the values of the default array that you set up in the previous section.
Run the pipeline up to and including the gem with your expression, and observe the resulting data sample. To do so, click the play button on either the canvas or the gem. Once the code has finished running, you can verify the results to make sure they match your expectations. You can explore the result of your gem in the Data Explorer.