- Live runtime logs for active or recent runs in the project editor.
- Historical runtime logs for completed runs, which are snapshots of the pipeline at execution time accessed through the Observability interface.
Open runtime logs
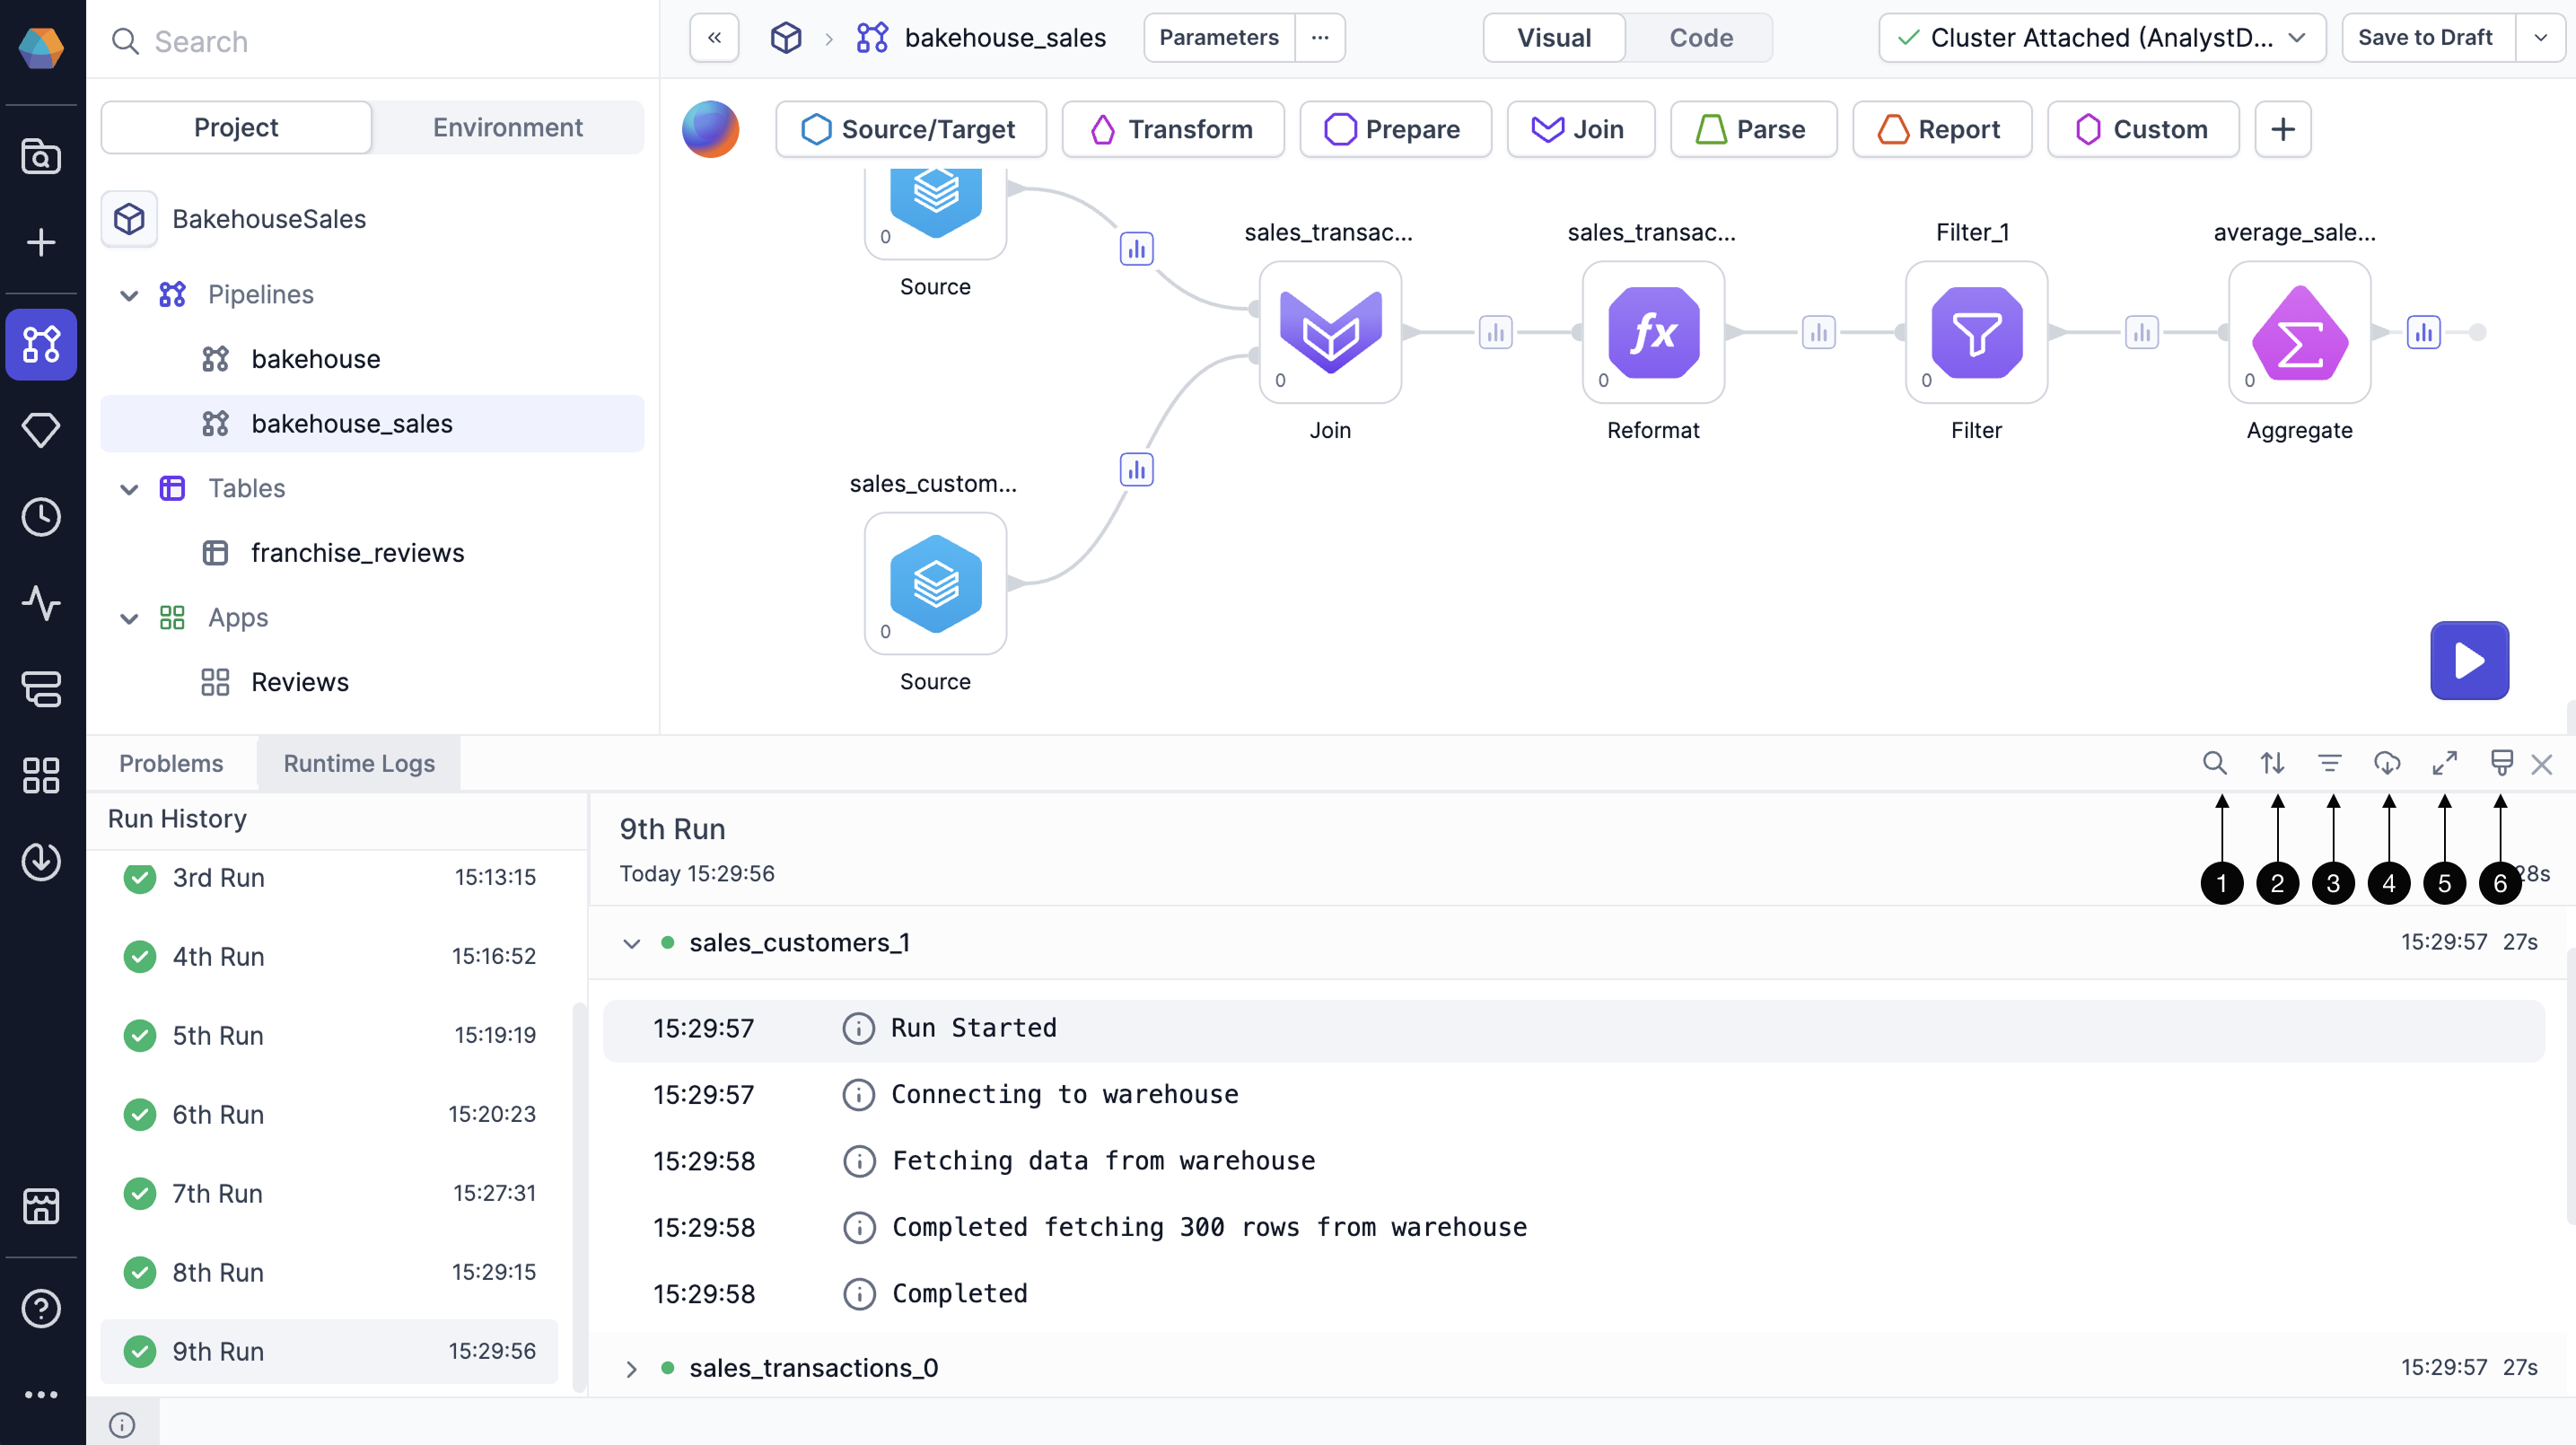
You can open runtime logs from the information footer at the bottom of the project editor. Runtime logs update in real time while your pipeline runs. Each log entry provides structured details that help you trace execution and diagnose issues. Logs include:- Pipeline steps: Execution details for every processing step, mapped directly to the gems in your visual pipeline.
- Execution sequence: The exact order in which steps were carried out.
- Timestamp: The start time of each step.
- Duration: How long each step took.
- Status information: Success, warning, and failure details for each operation.
You can also see runtime log information by hovering over each gem in the pipeline canvas. This
shows the duration and success/failure status of that step in the most recent run. Use this to
quickly spot bottlenecks, failed operations, or unusually slow steps without opening the full log
view.
Use runtime logs
In the Runtime Logs tab, you can use several tools to help navigate and analyze execution details.- Filter logs by keywords: Find specific information by entering search terms
- Sort logs: Organize logs chronologically
- Filter logs by log level: Focus on info, warning, or error messages
- Download logs: Save logs to your machine as a text file
- Expand log screen: Display a larger view of your logs
- Clear all logs: Remove log information for previous runs
If your pipeline fails to run, you’ll see an error message explaining the reason for the failure
displayed at the top of the corresponding log.
Access historical runtime logs
You can reopen runtime logs for completed pipeline runs through the Observability interface. Historical runtime logs help you investigate failures, compare past executions, validate pipeline behavior, and understand how a pipeline operated at a specific point in time. To access historical runtime logs:- Click Observability in the left sidebar and open the Run History tab.
- Locate the pipeline run you want to inspect and click See logs in the far-right column.
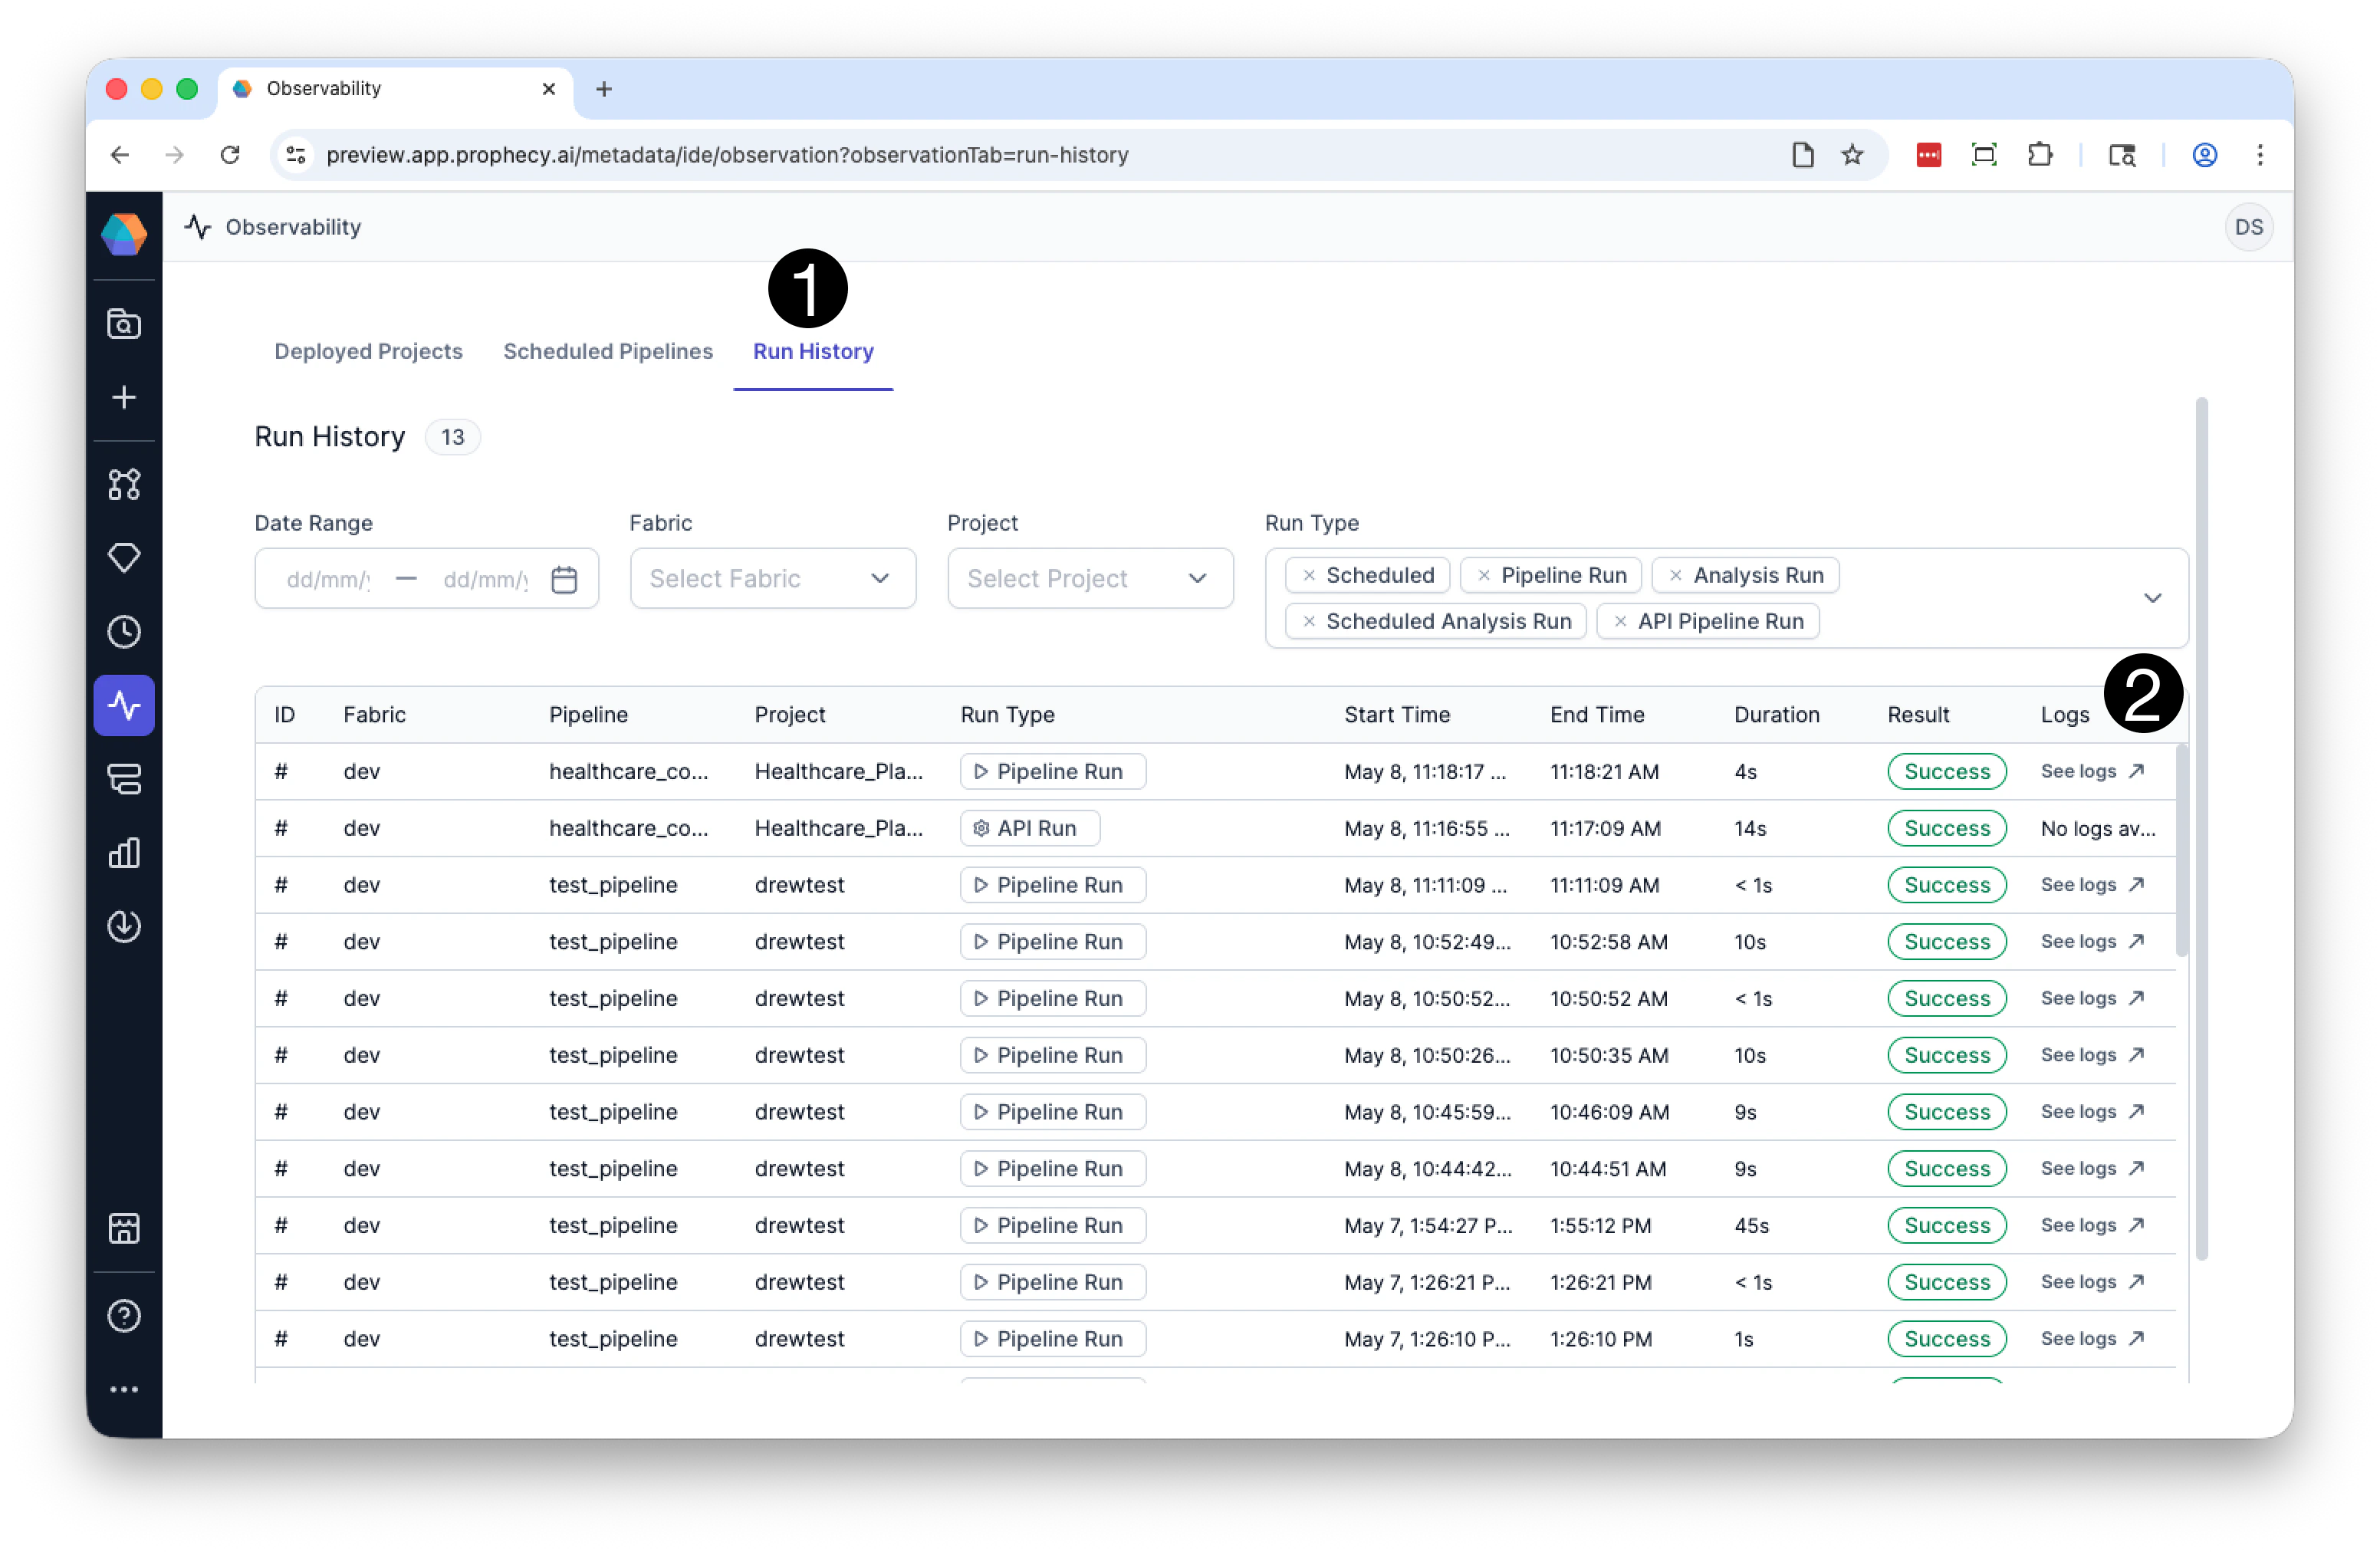
- Runtime logs for that execution.
- The pipeline snapshot associated with the run.
- Historical component execution states and statuses.
Historical Mode
When you open historical runtime logs, the pipeline opens in Historical Mode. Historical Mode reconstructs the pipeline exactly as it existed during the selected execution. This includes the pipeline graph, runtime logs, and component execution statuses.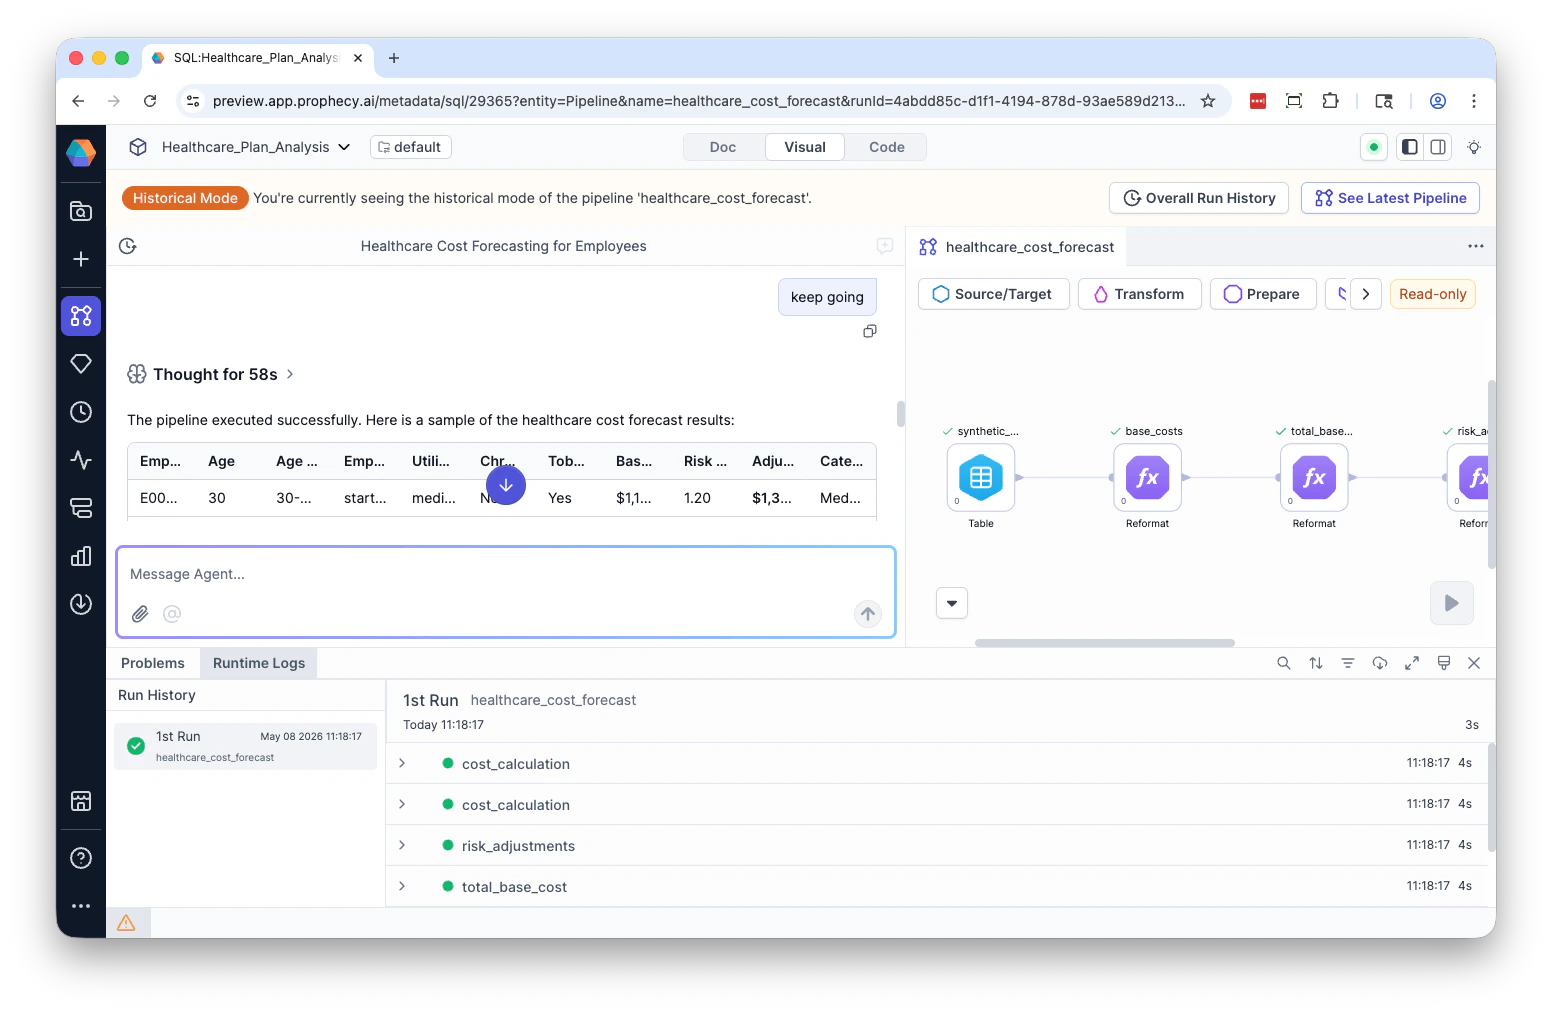
- The pipeline canvas becomes read-only.
- Runtime logs are restored for the selected run.
- Components display their historical execution states.
- Execution progress and failure states are preserved.
- You can switch between historical runs to compare executions.
- You can rerun historical pipeline snapshots.
- Return to overall run history.
- Exit Historical Mode and return to the latest pipeline version.
Pipeline snapshots and retention
Historical runtime logs rely on persisted pipeline snapshots and execution metadata. When available, Prophecy stores:- Runtime log output.
- Pipeline execution state.
- Component execution progress and statuses.
- Pipeline snapshots associated with completed runs.
SQL warehouse logs
You can find additional logs specific to pipeline queries in your SQL warehouse. If you are connected to a Databricks SQL warehouse, you can find these logs directly in Databricks. This extra visibility into query execution in Databricks helps you troubleshoot pipeline behavior and improve performance. If you have access to your Databricks workspace:- Navigate to SQL > Query History in the Databricks sidebar.
- Locate the SQL queries run during your pipeline’s execution window.
- Click on a query to see:
- Full SQL query
- Status (Success or Error)
- Start and end times
- Error messages
- Execution plan or profile
What’s next
Now that you know about runtime and publish logs, you might want to learn about audit logs and system logs, which provide visibility into platform-level and administrative activity.- Audit logs track events across entities like projects, pipelines, jobs, and fabrics. These logs help administrators understand who did what and when. For example, these logs can capture who creates a pipeline, releases a project, modifies a dataset, etc.
- System logs capture backend infrastructure details to support platform monitoring and troubleshooting. These include Kubernetes cluster configuration (such as resource quotas and node settings), cluster custom resources, config maps and files, and resource consumption metrics.