Quick profile
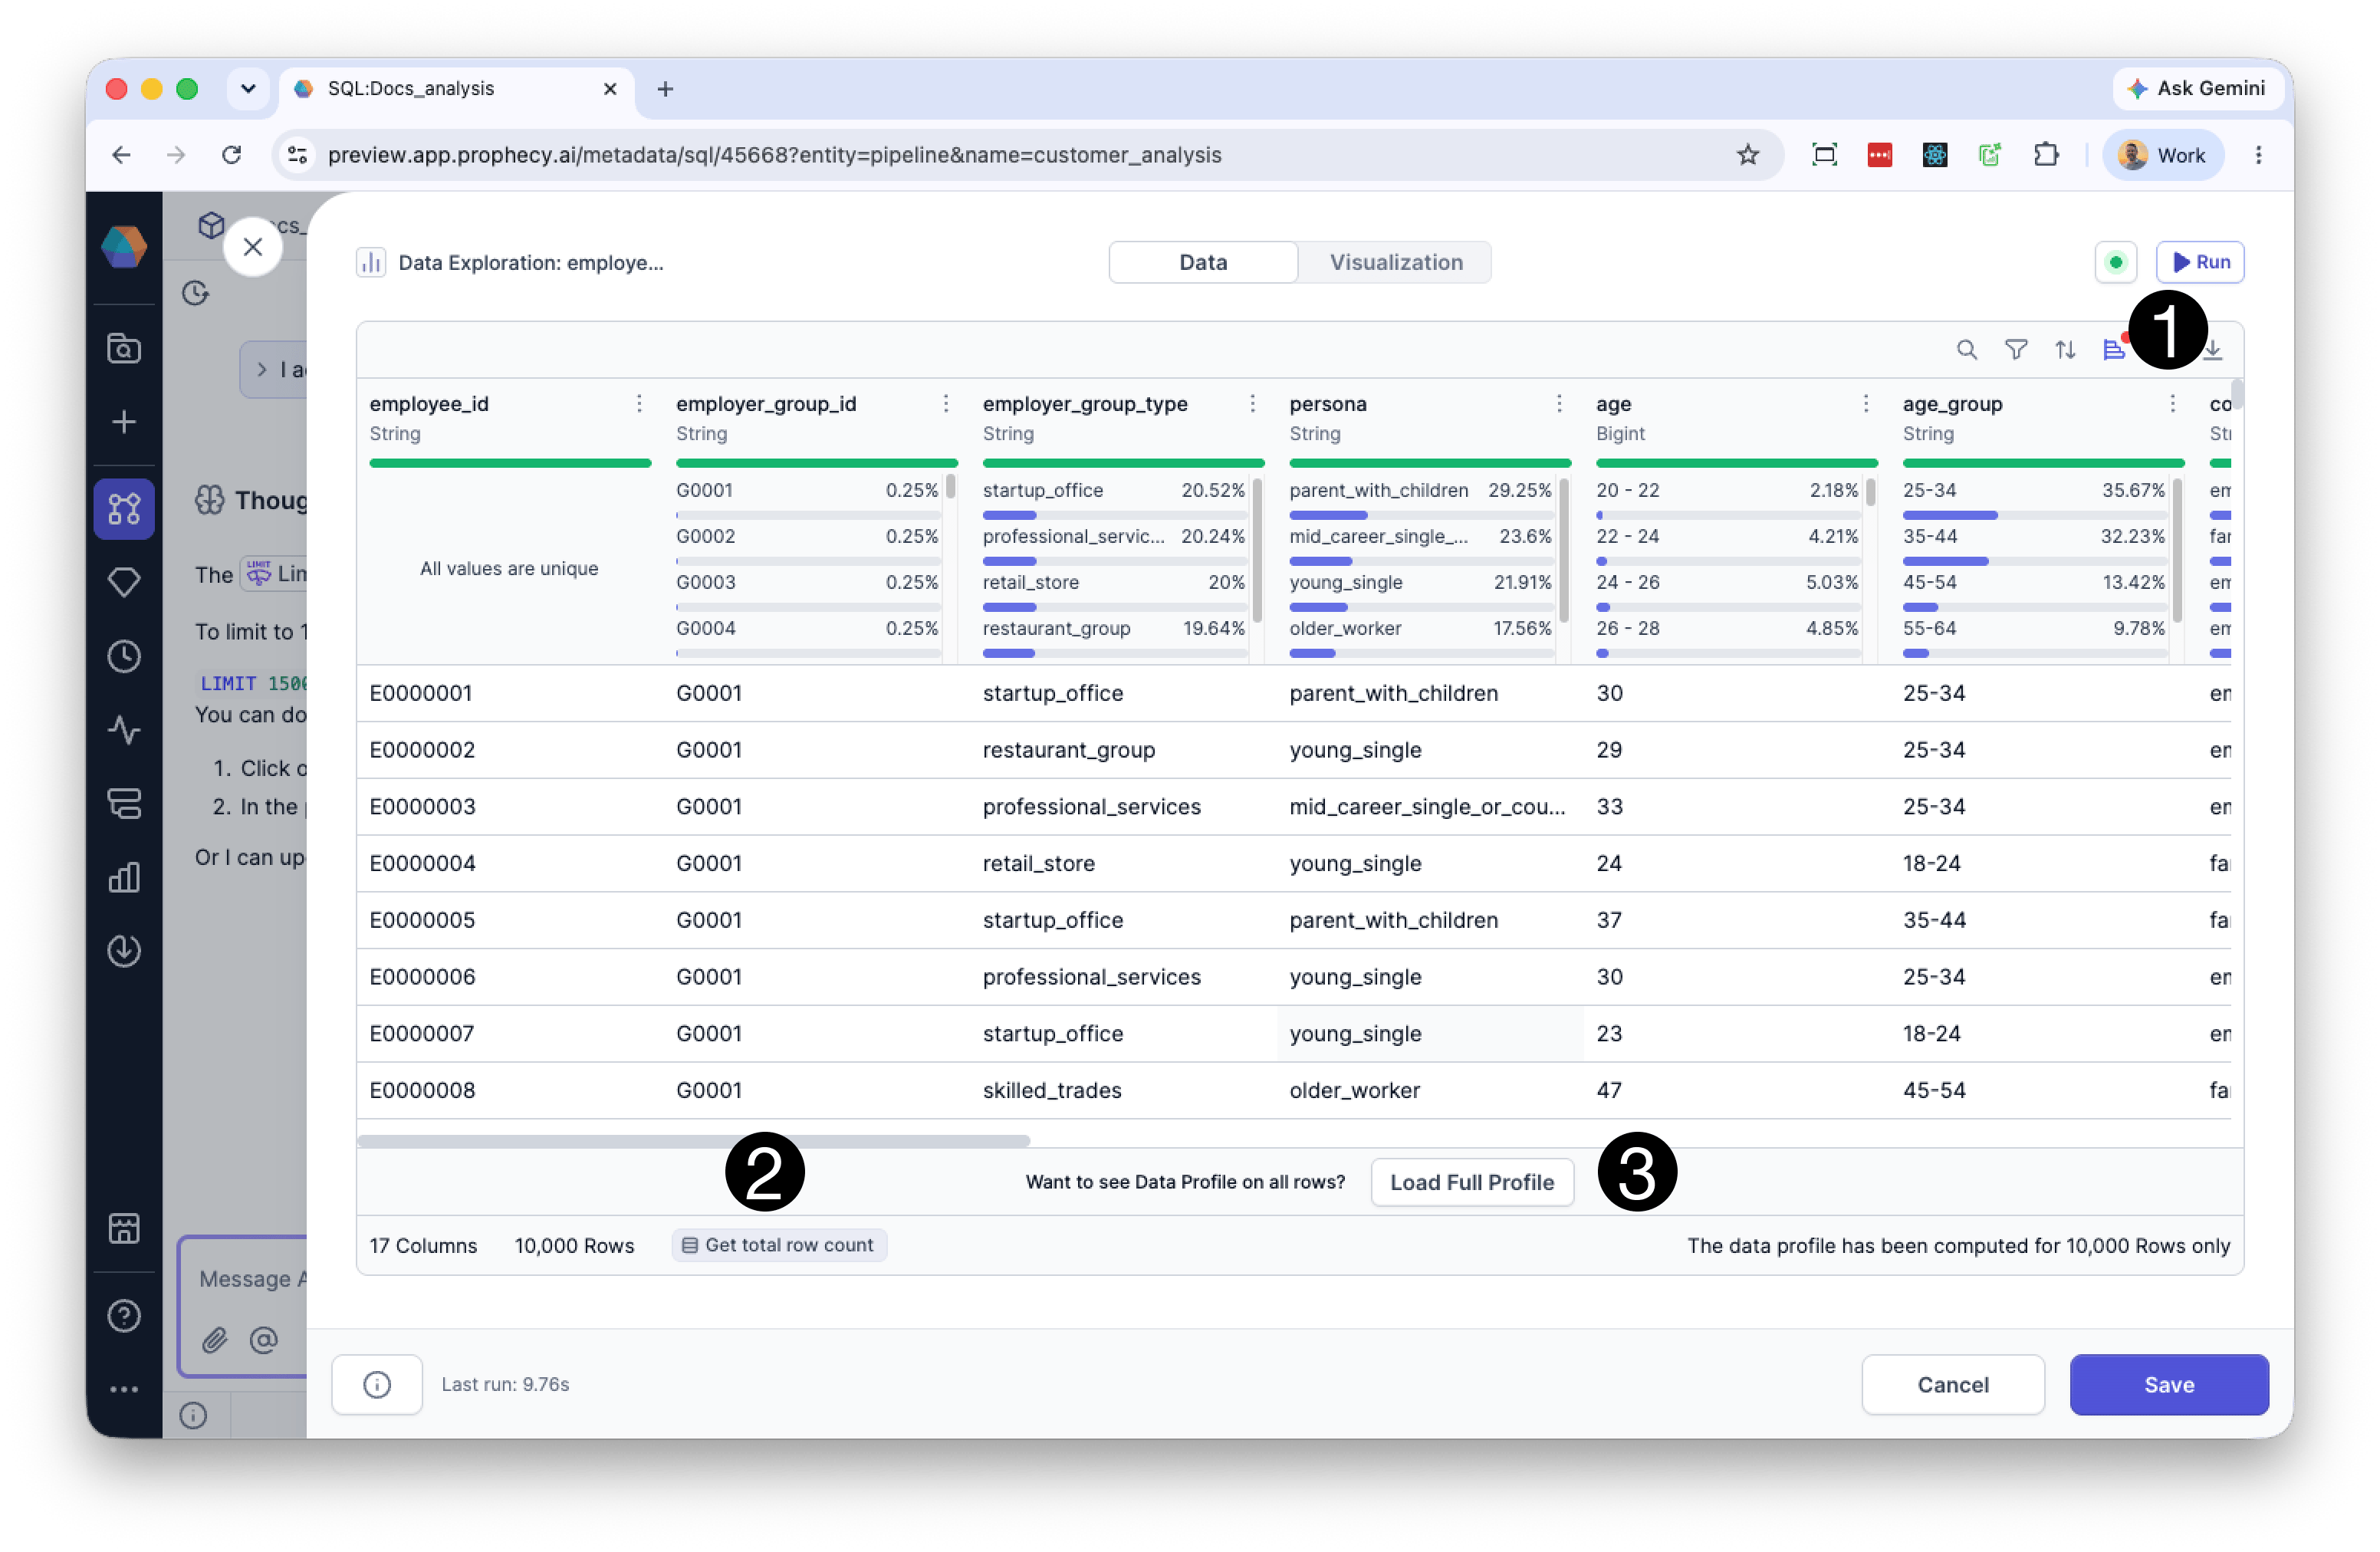
The Data Explorer includes data profiles that are generated on your sample data. You’ll be able to see high-level statistics for each column, including:- Percent of non-blank values: The percentage of values in the column that are not blank.
- Percent of null values: The percentage of values in the column that are null.
- Percent of blank values: The percentage of values in the column that are blank.
- Most common values: Displays the top four most frequent values in the column, along with the percentage of occurrences for each.
Expanded profile
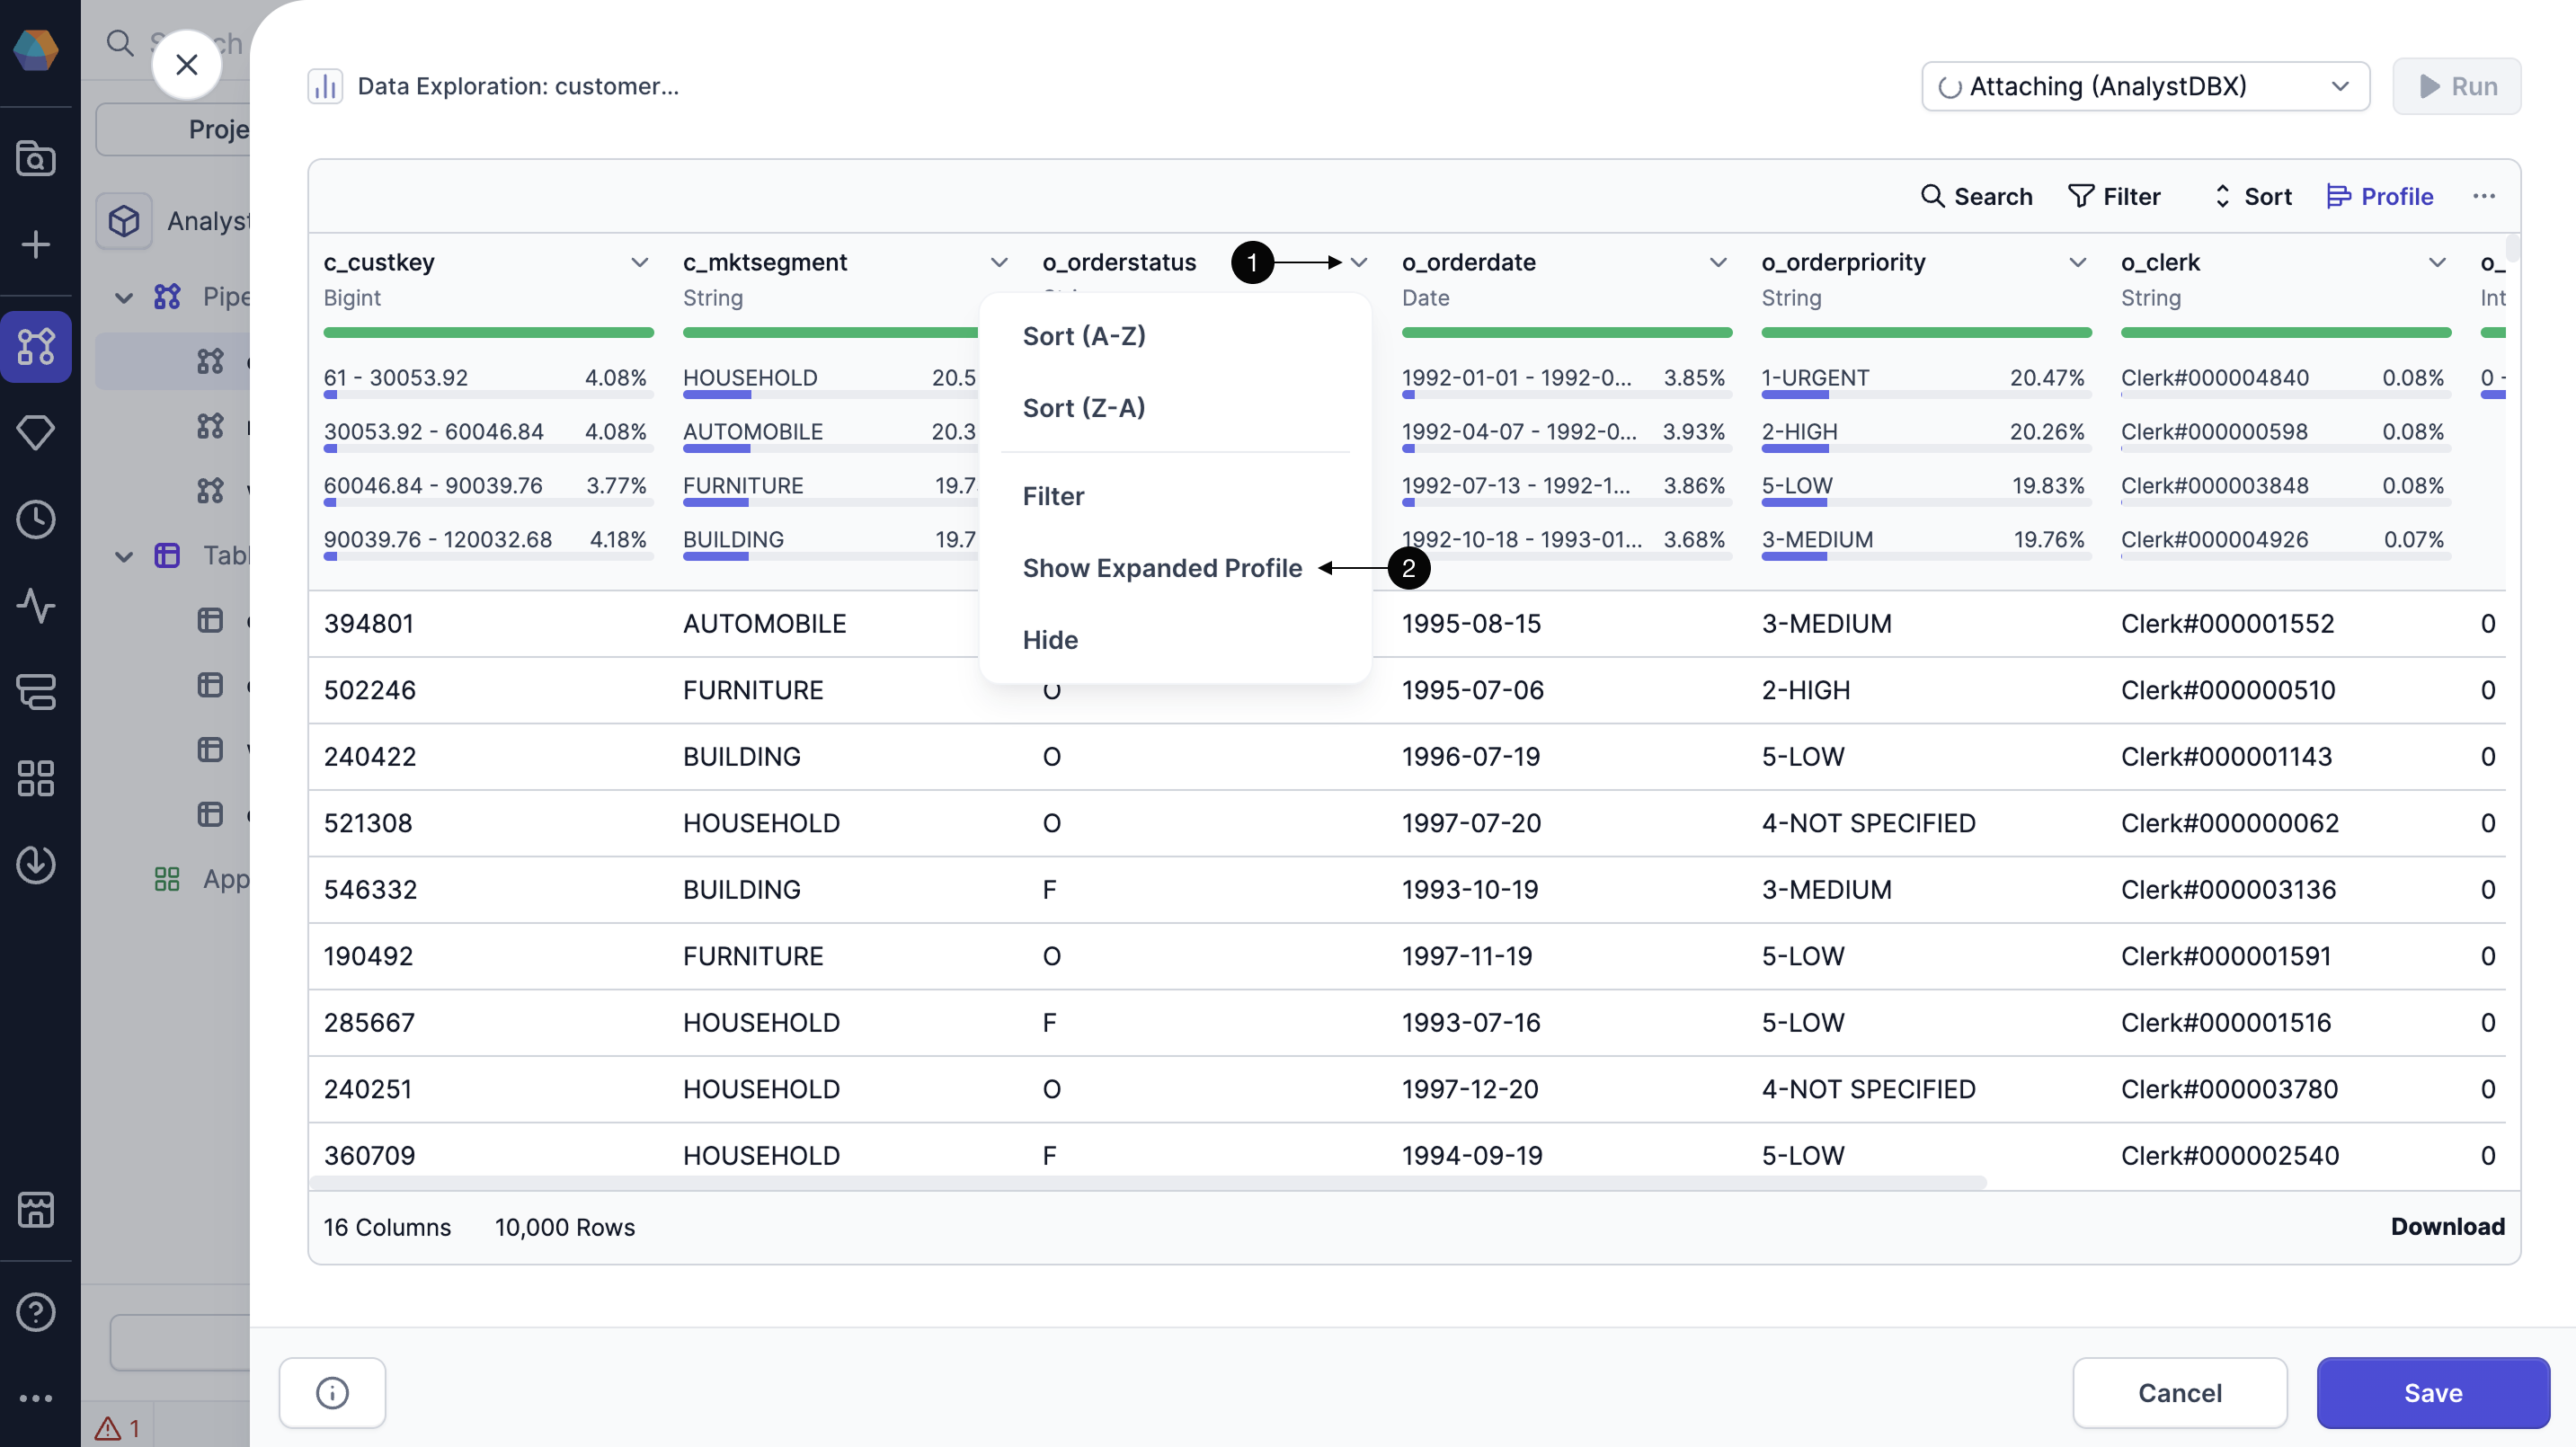
You can view a more detailed profile for any column in your dataset. When you open the expanded profile, Prophecy generates a deeper analysis of the column based on your sample data.All statistics in the expanded profile are computed on the same sample used in the Data Explorer.
- Click the dropdown arrow on the column you want to expand.
- Select Show Expanded Profile.
| Metric | Description |
|---|---|
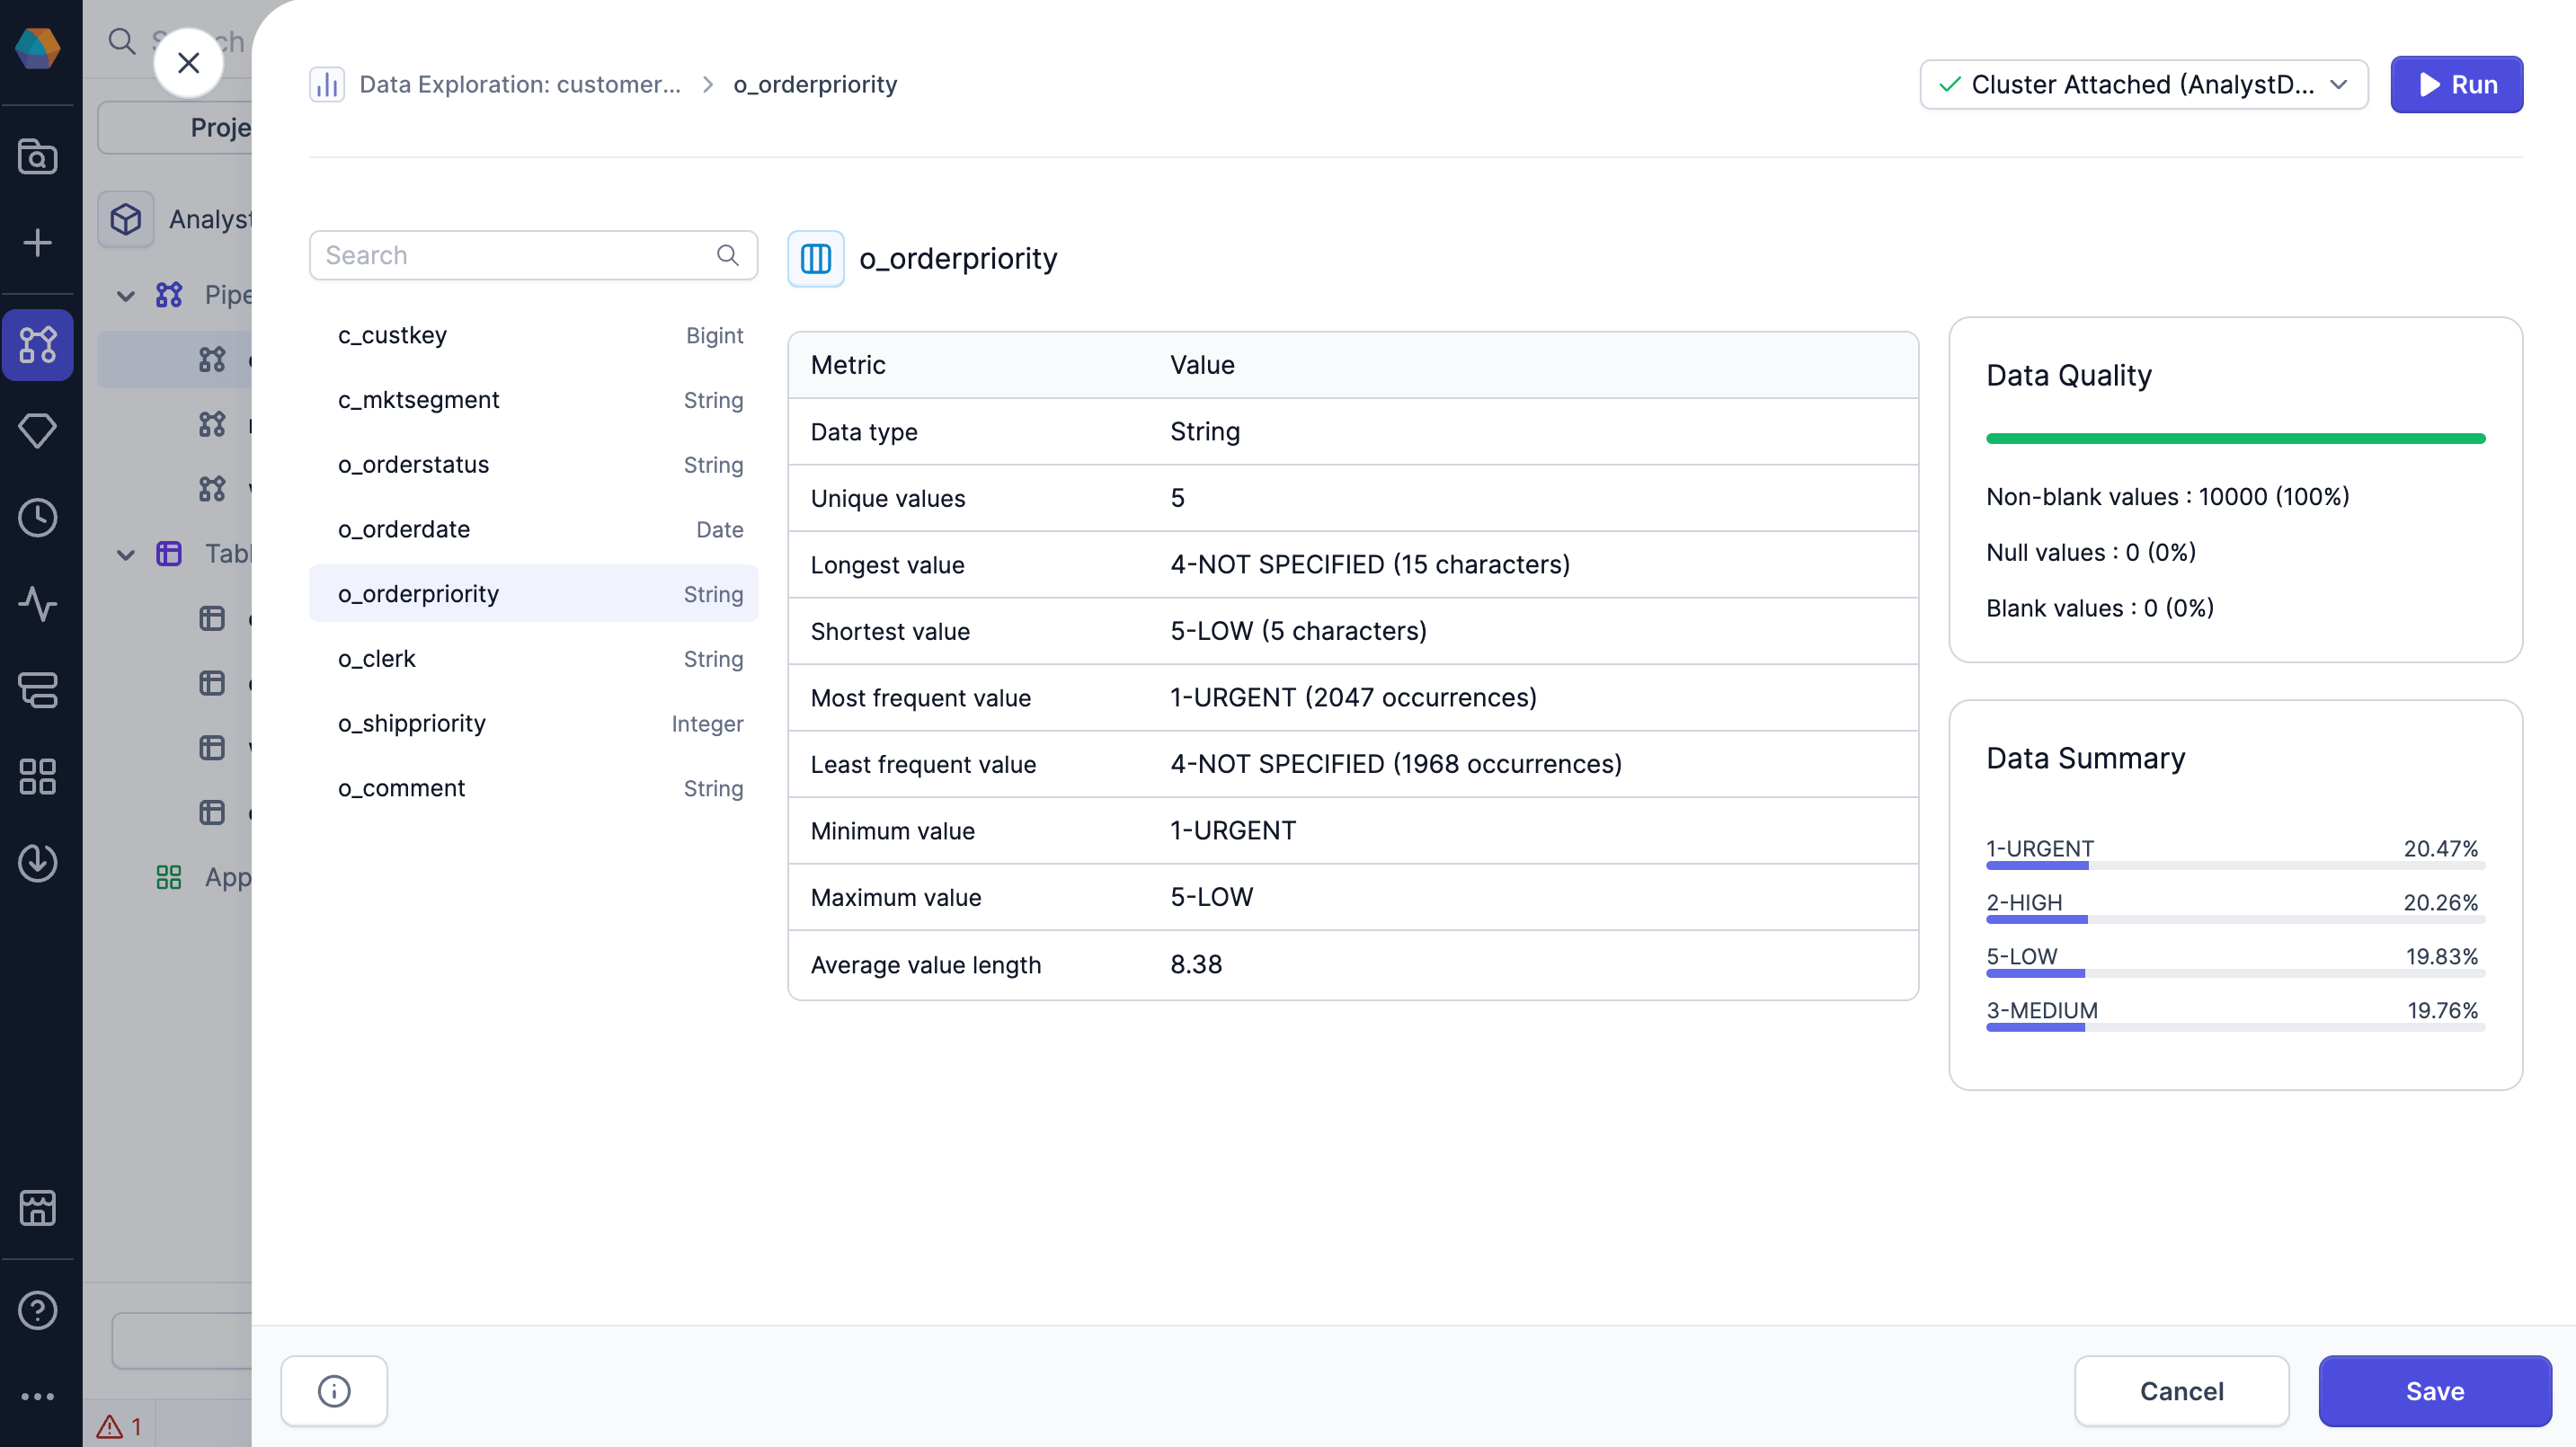
| Data type | Data type of the column. |
| Unique values | Number of unique values in the column. |
| Longest value | Longest value in the column and its length. |
| Shortest value | Shortest value in the column and its length. |
| Most frequent value | Most frequent value in the column and its number of occurrences. |
| Least frequent value | Least frequent value in the column and its number of occurrences. |
| Minimum value | Minimum value in the column. |
| Maximum value | Maximum value in the column. |
| Average value length | Average length of each value in the column. |
| Null values | Percent and number of null values in the column. |
| Blank values | Percent and number of blank values in the column. |
| Non-blank values | Percent and number of non-blank values in the column. |
| Data summary | Overview of the most common values in the column. |