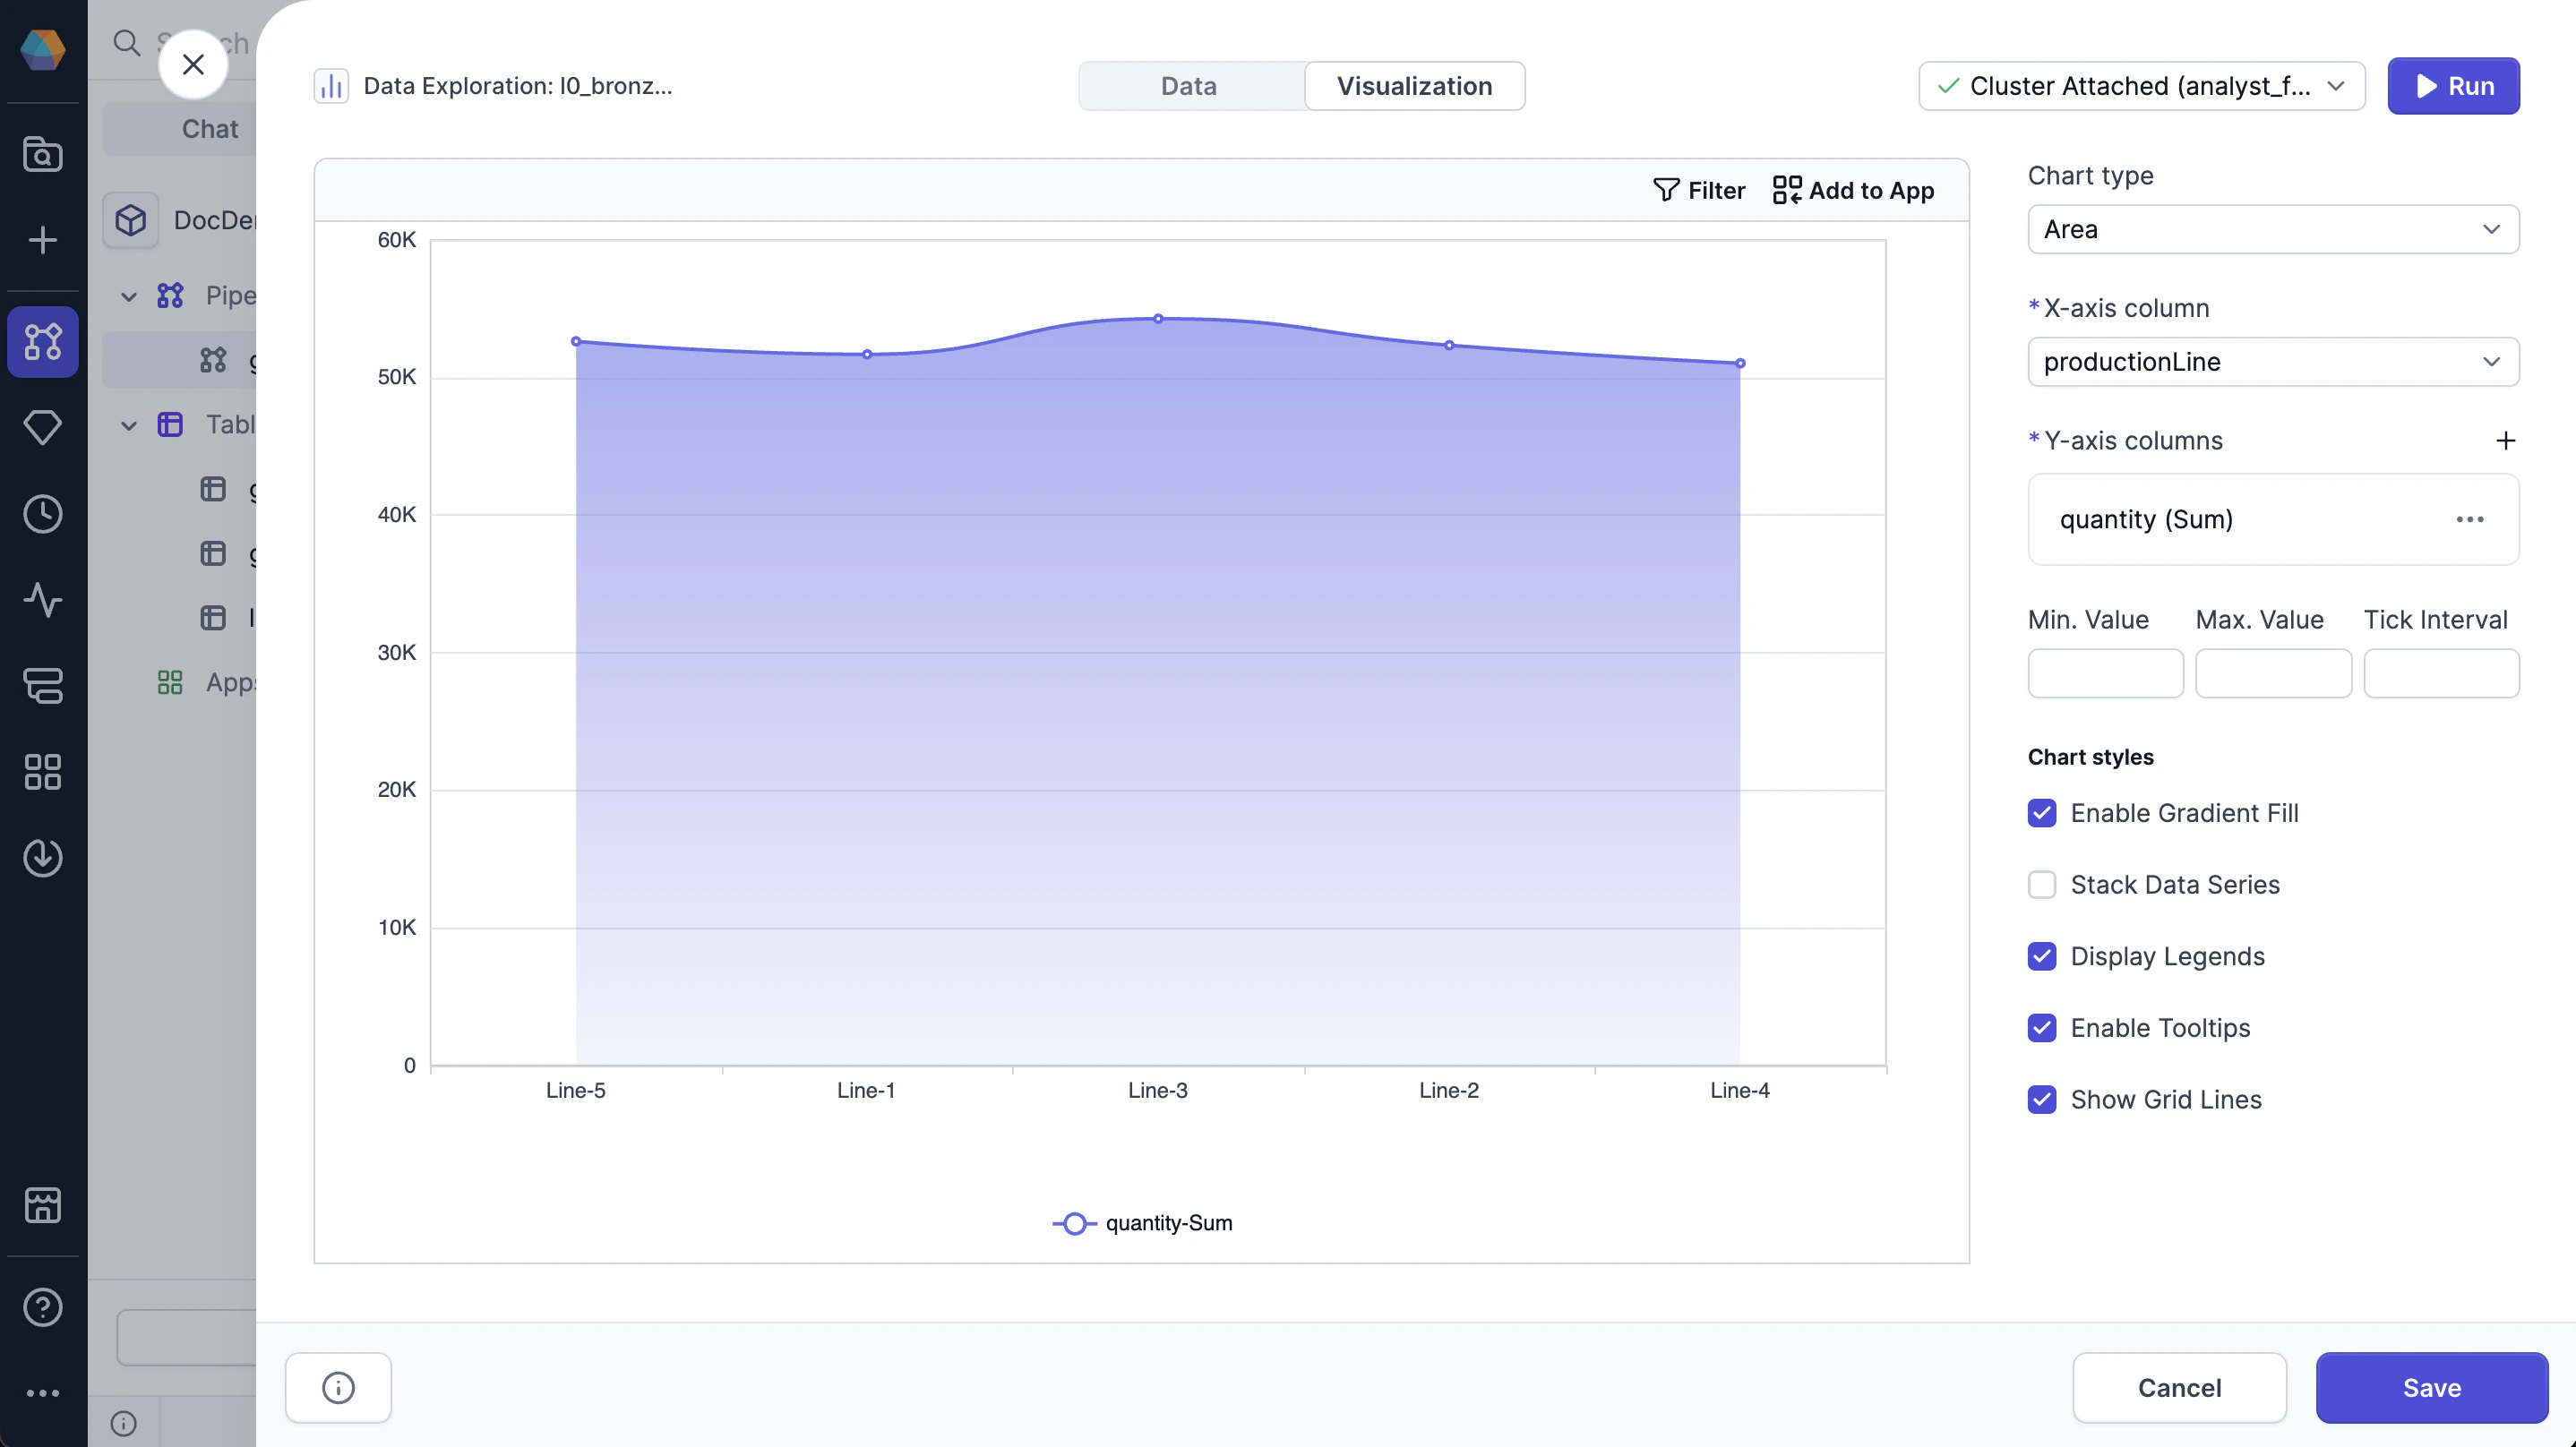
| X-axis column | Column used for the X-axis values, typically time or sequence. |
| Y-axis column | Column with aggregated values used for the Y-axis. |
| Min. Value | Minimum value displayed on the Y-axis. |
| Max. Value | Maximum value displayed on the Y-axis. |
| Tick Interval | Interval between tick marks on the Y-axis. |
| Enable Gradient Fill | Whether to apply a gradient fill under the area curve. |
| Stack Data Series | Whether to stack multiple data series on top of one another. |
| Display Legends | Whether to display the legend on the chart. |
| Enable Tooltips | Whether to display tooltips on hover. |
| Show Grid Lines | Whether to display grid lines on the chart. |