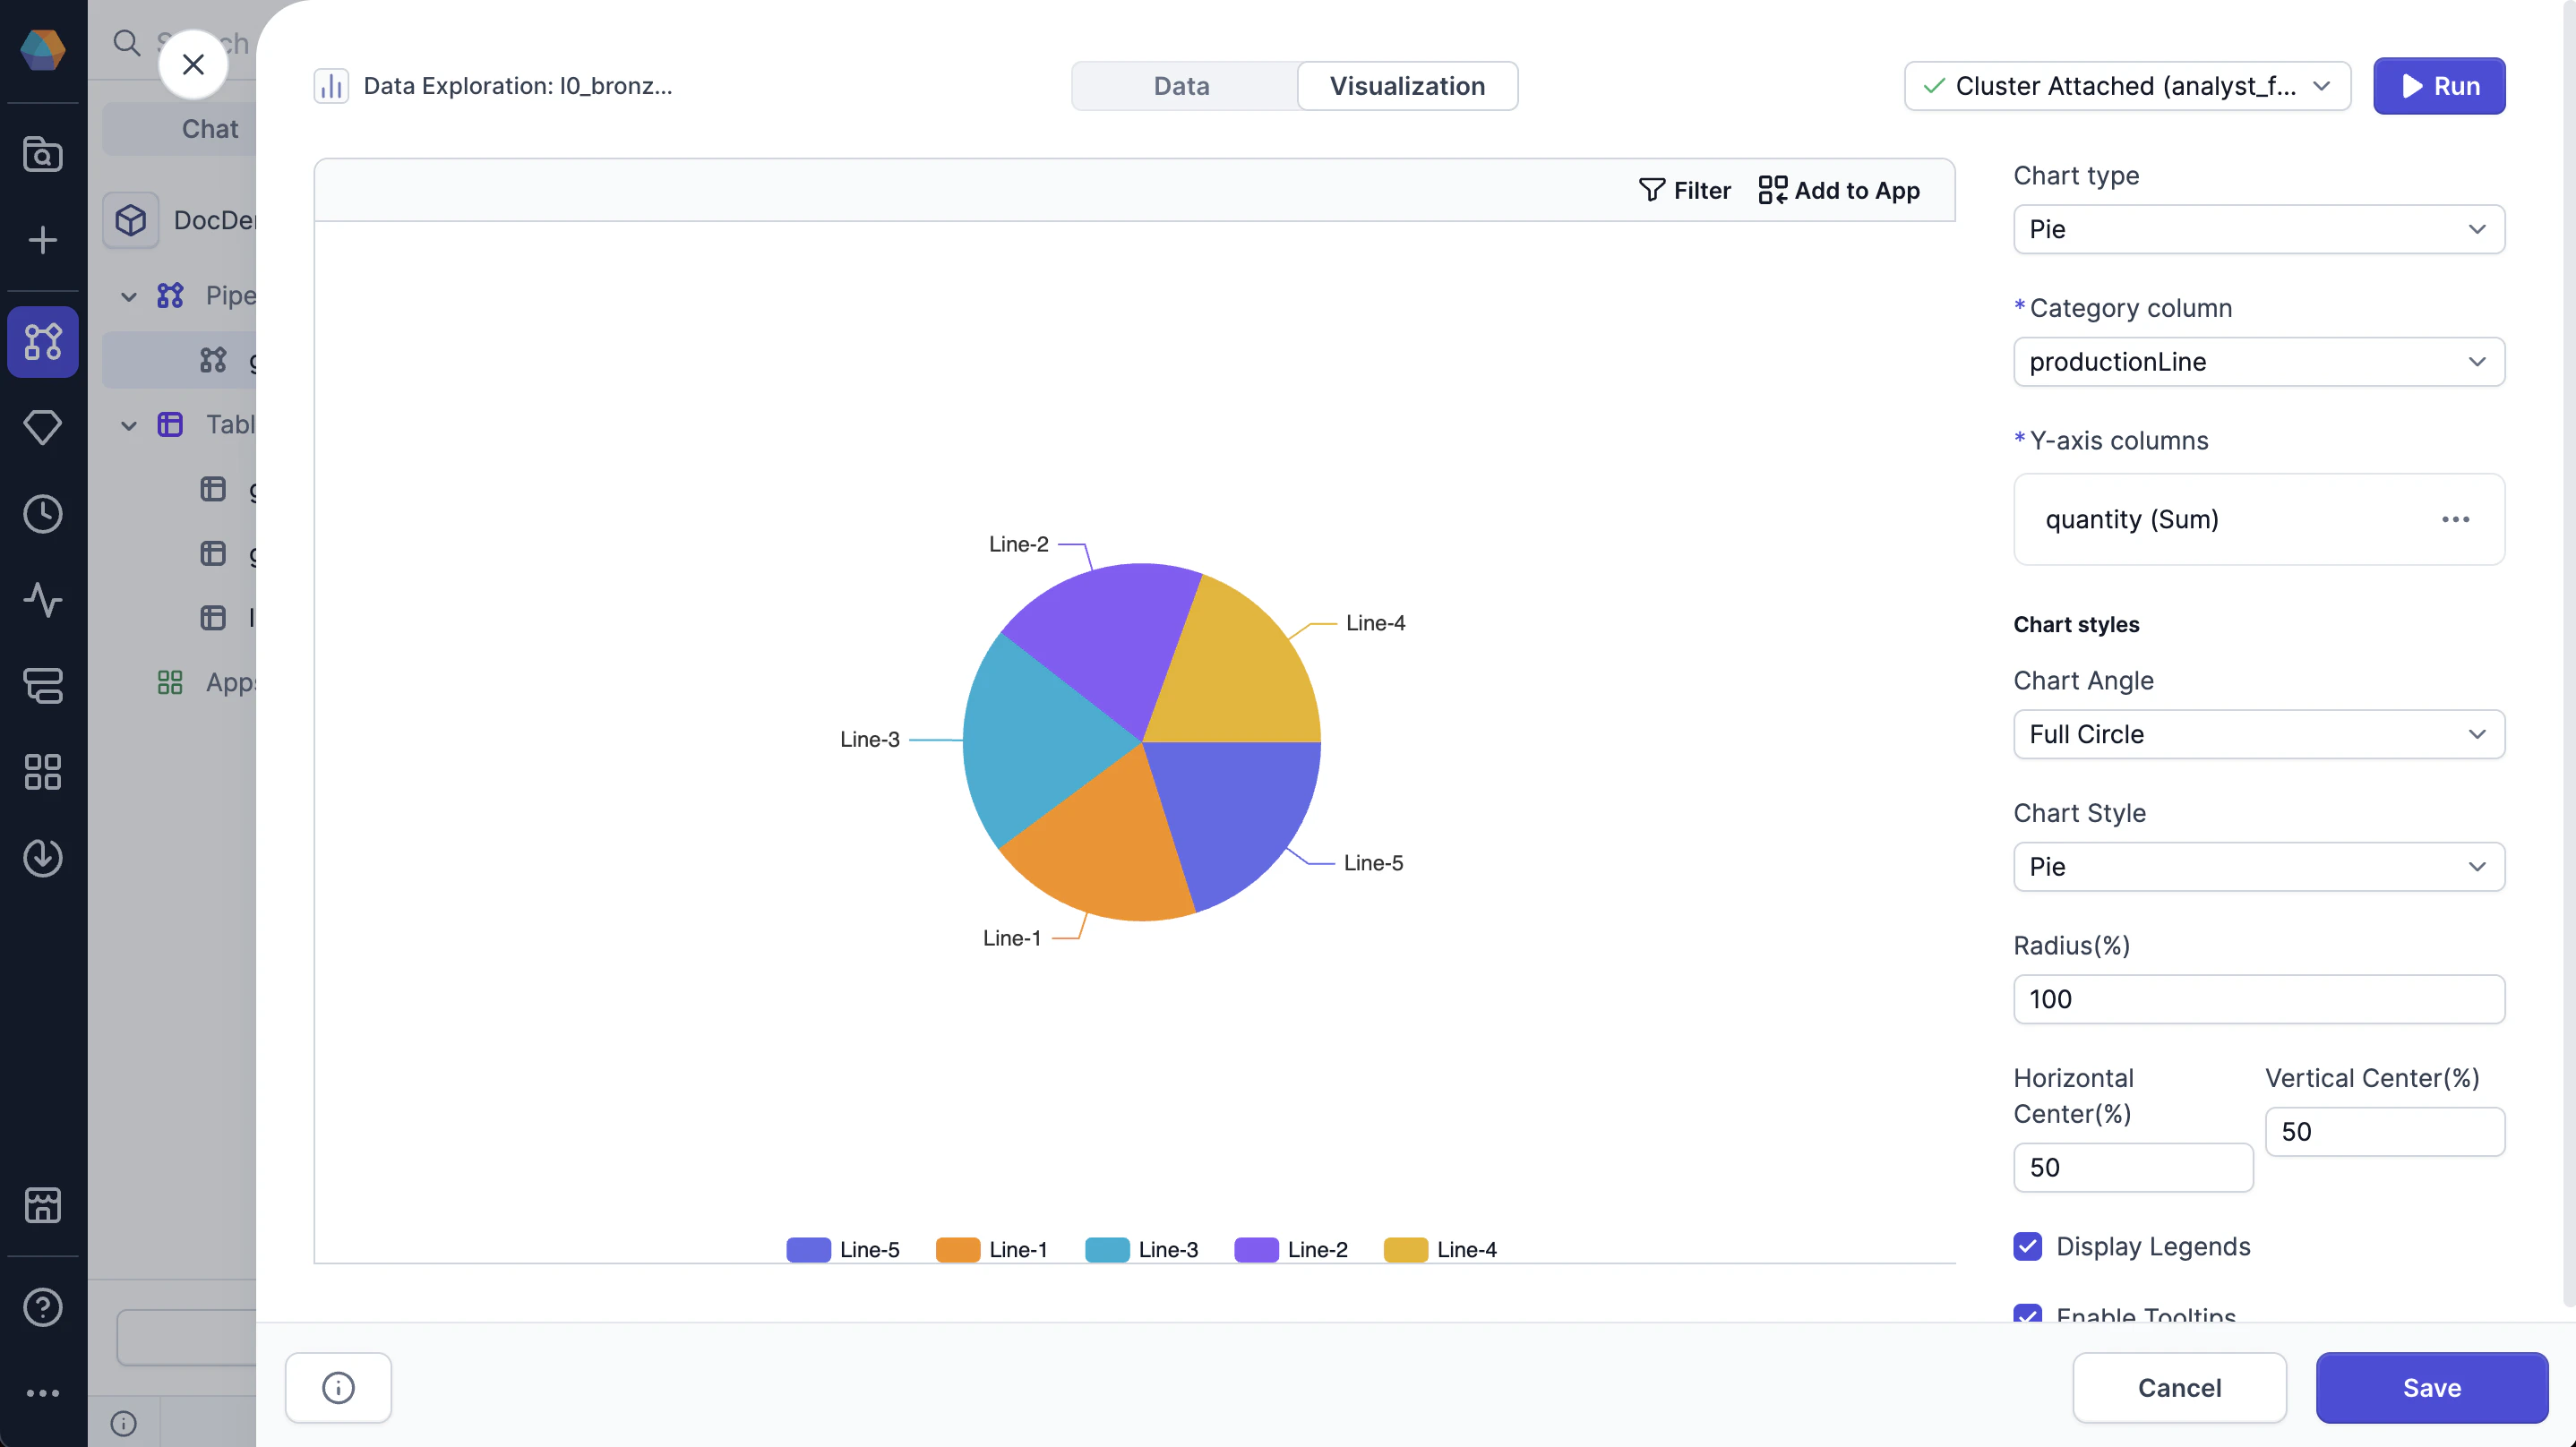
| Category column | Column used for pie chart segments. |
| Y-axis column | Column containing values to aggregate into segment sizes. |
| Chart angle | Starting angle in degrees for rendering the chart. |
| Chart style | Style of chart, either pie or donut. |
| Radius % (Pie style only) | Percentage of the chart canvas used for the pie’s radius (the overall size of the pie chart). |
| Inner and Outer Radius % (Donut style only) | Size of the inside and outside radius of the donut chart. |
| Horizontal center % | Percentage from the left edge of the chart canvas for positioning the pie’s center (the horizontal alignment of the chart). |
| Vertical center % | Percentage from the top edge of the chart canvas for positioning the pie’s center (the vertical alignment of the chart). |
| Display Legends | Whether to display the legend on the chart. |
| Enable Tooltips | Whether to display tooltips on hover. |